


Ellipse: Do you know the orbit of planets, moon, comets, and other heavenly bodies are elliptical? Mathematics defines an ellipse as a plane curve surrounding...
Last Modified 14-04-2025

Harvest Smarter Results!
Celebrate Baisakhi with smarter learning and steady progress.
Unlock discounts on all plans and grow your way to success!

Ellipse: Definition, Properties, Applications, Equation, Formulas
April 14, 2025
Altitude of a Triangle: Definition & Applications
April 14, 2025
Manufacturing of Sulphuric Acid by Contact Process
April 13, 2025
Refining or Purification of Impure Metals
April 13, 2025
Pollination and Outbreeding Devices: Definition, Types, Pollen Pistil Interaction
April 13, 2025
Electrochemical Principles of Metallurgy: Processes, Types & Examples
April 13, 2025
Acid Rain: Causes, Effects
April 10, 2025
Congruence of Triangles: Definition, Properties, Rules for Congruence
April 8, 2025
Complementary and Supplementary Angles: Definition, Examples
April 8, 2025
Nitro Compounds: Types, Synthesis, Properties and Uses
April 8, 2025
Ellingham Diagrams: Based on enthalpy and entropy values, the Gibbs equation allows us to predict the spontaneity of a process. H.G.T Ellingham proposed the Ellingham diagram to forecast the spontaneity of metal oxide reduction. The Ellingham diagram is one of the most simple graphical representations of thermodynamic data related to metal production.
These metals are obtained from ore by three main steps:
Using the Ellingham diagram, you will study the reduction of several metals by selecting an appropriate reducing agent in this article. You’ll also be familiar with the Ellingham diagram’s properties, advantages, and disadvantages.

The graphical representation showing the variation of Gibbs energy with an increase of temperature for the formation of oxides is known as the Ellingham diagram. H.J.T. Ellingham first used it.
Thermodynamic principles help in deciding the temperature and choice of reducing agents in reduction processes. The feasibility of the process can be predicted in terms of Gibbs energy change \(\left({\Delta {\text{G}}} \right)\) at a particular temperature, which is related to the enthalpy change \(\left({\Delta {\text{H}}} \right)\) and entropy change \(\left({\Delta {\text{S}}} \right)\) as
\(\Delta {\text{G}} = \Delta {\text{H}} – {\text{T}}\Delta {\text{S}}\)
For any reaction, Gibb’s energy change is also related to the equilibrium constant \(\left({\text{K}} \right)\) of the reactant-product system at the temperature \({\text{T}}\) as:
\(\Delta {{\text{G}}^ \circ } = – {\text{RT}}\,\ln \,{\text{K}}\)
For any reaction, \(\Delta {\text{G}}\) must be negative, then \({\text{K}}\) will be positive.
Important Questions on Ellingham Diagrams
1. \(\Delta {{\text{G}}^ \circ }\) curves for most of the reactions involving the formation of \({{\text{M}}_{\text{x}}}{\text{O}}\left({\text{s}} \right)\) have a positive slope.
\(2{\text{xM}}\left({\text{s}} \right) + {{\text{O}}_2}\left({\text{g}} \right) \to 2{{\text{M}}_{\text{x}}}{\text{O}}\left({\text{s}} \right)\)
In the above reaction, randomness i.e., entropy \(\left({\Delta {\text{S}}} \right)\) of the system, decreases due to the combination of solid elements with gaseous oxygen. Hence \(\Delta {\text{S}}\) value becomes negative. Therefore, the value of \(\Delta {\text{G}}\) in the equation \(\Delta {\text{G}} = \Delta {\text{H}} – {\text{T}}\Delta {\text{S}}\) is increases. This leads to a positive slope in the curve.
2. Each plot is a straight line except when there is some change in phase (solid\( \to \)liquid or liquid \( \to \) gas). The temperature at which such a change occurs is indicated by an increase in the slope on the positive side.
3. Each curve in the Ellingham diagram consists of a point below which \(\Delta {\text{G}}\) is negative. This indicates that below this point, the oxide \(\left( {{{\text{M}}_{\text{x}}}{\text{O}}} \right)\) formed is stable. Above this point, the oxide will decompose on its own.
4. Since, the Ellingham diagram consists of \(\Delta {{\text{G}}^ \circ }\) vs \({\text{T}}\) values at different temperatures for the oxidation of common metals and some reducing agents, a metallurgical process involving the reduction of oxide can easily be interpreted.
5. The Ellingham diagrams for sulphides indicates that reduction of \({{\text{M}}_{\text{x}}}{\text{S}}\) is difficult because \(\Delta {{\text{G}}^ \circ }\) for \({{\text{M}}_{\text{x}}}{\text{S}}\) is not compensated.
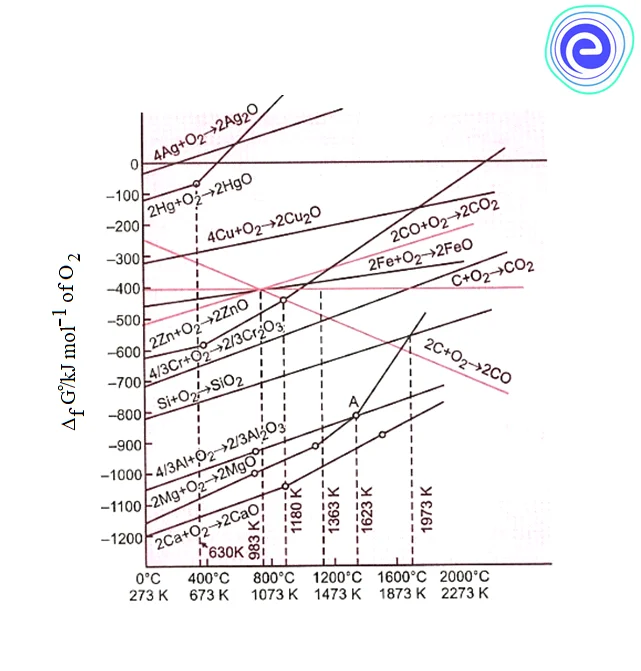
The study of Ellingham diagrams for common metallurgical processes shows that
1. At temperature above \(1073\,{\text{k}},\) coke will be reducing the \({\text{FeO}},\) and itself be oxidised to \({\text{CO}}{\text{.}}\)
2. Reduction of \({\text{F}}{{\text{e}}_2}{{\text{O}}_3}\) and \({\text{F}}{{\text{e}}_3}{{\text{O}}_4}\) can be carried out by relatively lower temperature \(\left({500 – 800\,{\text{k}}} \right)\) by \({\text{CO}}.\)
3. The oxide ores of copper \(\left({{\text{C}}{{\text{u}}_2}{\text{O}}} \right)\) can be easily reduced by heating with coke because both the lines of \({\text{C}},{\text{CO}}\) and \({\text{C}},{\text{C}}{{\text{O}}_2}\) are at much lower positions, particularly after \(500 – 600\,{\text{k}}.\)
4. \({\text{Al}}\) cannot reduce \({\text{MgO}}\) to \({\text{Mg}}\) at the temperature below \(1773\,{\text{k}},\) but \({\text{Mg}}\) can reduce \({\text{A}}{{\text{l}}_2}{{\text{O}}_3}\) to \({\text{Al}}{\text{.}}\)
5. \({\text{Al}}\) can reduce \({\text{C}}{{\text{r}}_2}{{\text{O}}_3}\) to \({\text{Cr,}}\) but \({\text{Cr}}\) cannot reduce \({\text{A}}{{\text{l}}_2}{{\text{O}}_3}\) to \({\text{Al.}}\)
6. Before \(983\,{\text{k}},{\text{CO}}\) is a more effective reducing agent than \({\text{C}}\) and above \(983\,{\text{k}},{\text{C}}\) is a better reducing agent than \({\text{CO}}{\text{.}}\)
Ellingham diagram clearly explains why the reactions are slow when every species is in solid-state and why the reactions are smooth when the ore melts down.
In the equation, \(\Delta {\text{G}} = \Delta {\text{H}} – {\text{T}}\Delta {\text{S}},\Delta {\text{H}}\) and \(\Delta {\text{S}}\) remain nearly constant even on changing temperature. Therefore, a dominant variable is only \({\text{T}}{\text{.}}\) However, \(\Delta {\text{S}}\) increases when the compound melts or evaporates. Thus, increase in \({\text{T}}\) and \(\Delta {\text{S}}\) makes value of \(\Delta {\text{G}}\) more negative, and the reaction becomes smooth when the ore melts down.

1. Kinetics Of Reduction: Ellingham diagram simply suggests whether the reduction of a given metal oxide with a particular reducing agent is possible or not. But it does not explain anything about the kinetics of the reduction process, i.e., how fast will the reduction process be?
2. Reactant/Product Equilibrium: The interpretation of \(\Delta {{\text{G}}^ \circ }\) is based upon \({\text{K,}}\) i.e., \(\Delta {{\text{G}}^ \circ } = – {\text{RT}}\,\ln \,{\text{K}}.\) Thus, it is assumed that reactants and products are in equilibrium.
\({{\text{M}}_{\text{x}}}{\text{O}} + {{\text{A}}_{{\text{red }}}} \leftrightarrows {\text{xM}} + {\text{A}}{{\text{O}}_{\text{x}}}\)
But it is not always true because the reactants/products may be solids.
Learn Examples on Ellingham Diagram Here
The meaning of the Ellingham diagram and how to plot an Ellingham diagram was discussed in this article. You can select the appropriate reducing agent for various metallurgical processes by understanding the Ellingham diagram. You should also be able to recollect the Ellingham diagram’s properties, benefits, and limits, among other things.

Q.1. How to draw an Ellingham diagram?
Ans: The Ellingham diagram is plotted as the variation of Gibbs energy with an increase of temperature for the formation of oxides.
Q.2. How do you use the Ellingham diagram?
Ans: The Ellingham diagram consists of \(\Delta {{\text{G}}^ \circ }\) values at different temperatures for the oxidation of common metals and some reducing agents. Hence, a metallurgical process involving the reduction of oxide can easily be interpreted with the use of the Ellingham diagram.
Q.3. Why do lines have a positive slope in the Ellingham diagram?
Ans: In the reaction, \(2{\text{xM}}\left({\text{s}} \right) + {{\text{O}}_2}\left({\text{g}} \right) \to 2{{\text{M}}_{\text{x}}}{\text{O}}\left({\text{s}} \right),\) randomness i.e., entropy \(\left({\Delta {\text{s}}}\right)\) of the system, decreases due to the combination of solid elements with gaseous oxygen. Hence \(\left({\Delta {\text{s}}}\right)\) value becomes negative. Therefore, the value of \(\left({\Delta {\text{G}}}\right)\) in the equation \(\Delta {\text{G}} = \Delta {\text{H}} – {\text{T}}\Delta {\text{S}}\) increases. This leads to the positive slope in the Ellingham lines.
Q.4. Is the Ellingham diagram important for JEE mains?
Ans: Yes, the Ellingham diagram is important to select the correct reducing agent for the given reaction, to identify the metal being reduced, to select the good reducing agent based on \(\Delta {\text{G}}\) value, etc.
Q.5. What is the information we can infer from the Ellingham diagram?
Ans: Ellingham diagram clearly explains why the reactions are slow when every species is in solid state and why the reactions are smooth when the ore melts down. The temperature at which phase change occurs is indicated by an increase in the slope on the positive side. Each curve in the Ellingham diagram consists of a point below which \(\Delta {\text{G}}\) is negative. This indicates that below this point, the oxide \(\left({{{\text{M}}_{\text{x}}}{\text{O}}} \right)\) formed is stable. Above this point, the oxide will decompose on its own.
Q. 6.Which plot gives Ellingham diagram?
Ans: The variation of Gibbs energy (\(\Delta {\text{G}}\) in \({\text{kJ}}/{\text{mol}}\)) with an increase of temperature (\({\text{T}}\) in \({\text{k}}\) or \(^0{\text{C}}\)) for the formation of oxides gives the Ellingham diagram.
Study Diagrams of Standard Energy of formation of Oxides versus Temperature
We hope this detailed article on the Ellingham diagram is helpful to you. If you have any queries on Ellingham diagrams or in general about this page, ping us through the comment box below and we will get back to you as soon as possible.


