CBSE Class 9 Hindi 2025: Hindi is one of the main subjects for students studying in CBSE Class 9. The Central Board of Secondary Education...

CBSE Class 9 Hindi 2025: Download Syllabus PDF
February 24, 2025
Exercise 14.3 Class 9 Maths: Chapter 14 of CBSE Class 9th NCERT Book is Statistics. Statistics is the area of study dealing with the presentation, analysis, and interpretation of data. In this chapter, the students learn about statistics and how to present the data graphically in the form of bar graphs, histograms, and frequency polygons. The chapter also deals with the three measures of central tendency for ungrouped data.
Exercise 14.3 of Class 9 Maths is based on Graphical Representation of Data in Statistics. You can find the solutions to all the questions of this exercise in the later sections of this article. Read the complete article to know more about Class 9 Maths Chapter 14 Exercise 14.3, refer to its NCERT Solutions, and learn basic concepts of this topic.
The NCERT Solutions for Statistics Exercise 14.3 Class 9 Maths will provide you with step-by-step solutions to all the questions of the exercise. The solutions for Class 9 Ex 14.3 are prepared by experienced subject matter experts who have utilised their experience to develop such easy-to-understand solutions for you. Before getting to the detailed NCERT solutions, let us have an overview of NCERT Solutions for Class 9 Maths Chapter 14 Exercise 14.3.
| Particulars | Details |
|---|---|
| Name of the Chapter | Statistics |
| Exercise Number | Ex 14.3 |
| Topic Name | Graphical Representation of Data in Statistics |
| Language | English |
| Solution Type | Questions and Answers |
| Official Website | https://ncert.nic.in/ |
The NCERT Solutions for Statistics Exercise 14.3 Class 9 Maths have been prepared by the brilliant subject matter experts at Embibe who have years of experience in this domain. The step-by-step solutions to the questions will help you understand the concepts and arrive at the answers quickly. Students preparing for CBSE Class 9 exams must solve all the questions of Class 9 Maths Chapter 14 Exercise 14.3 to learn Graphical Representation of Data in Statistics. The major benefits of NCERT Solutions for Statistics Exercise 14.3 Class 9 Maths are provided below:
Bar Graphs: A bar graph is a pictorial representation of data in which usually bars of uniform width are drawn with equal spacing between them on one axis (say, the x-axis), depicting the variable. The values of the variable are shown on the other axis (say, the y-axis), and the heights of the bars depend on the values of the variable.

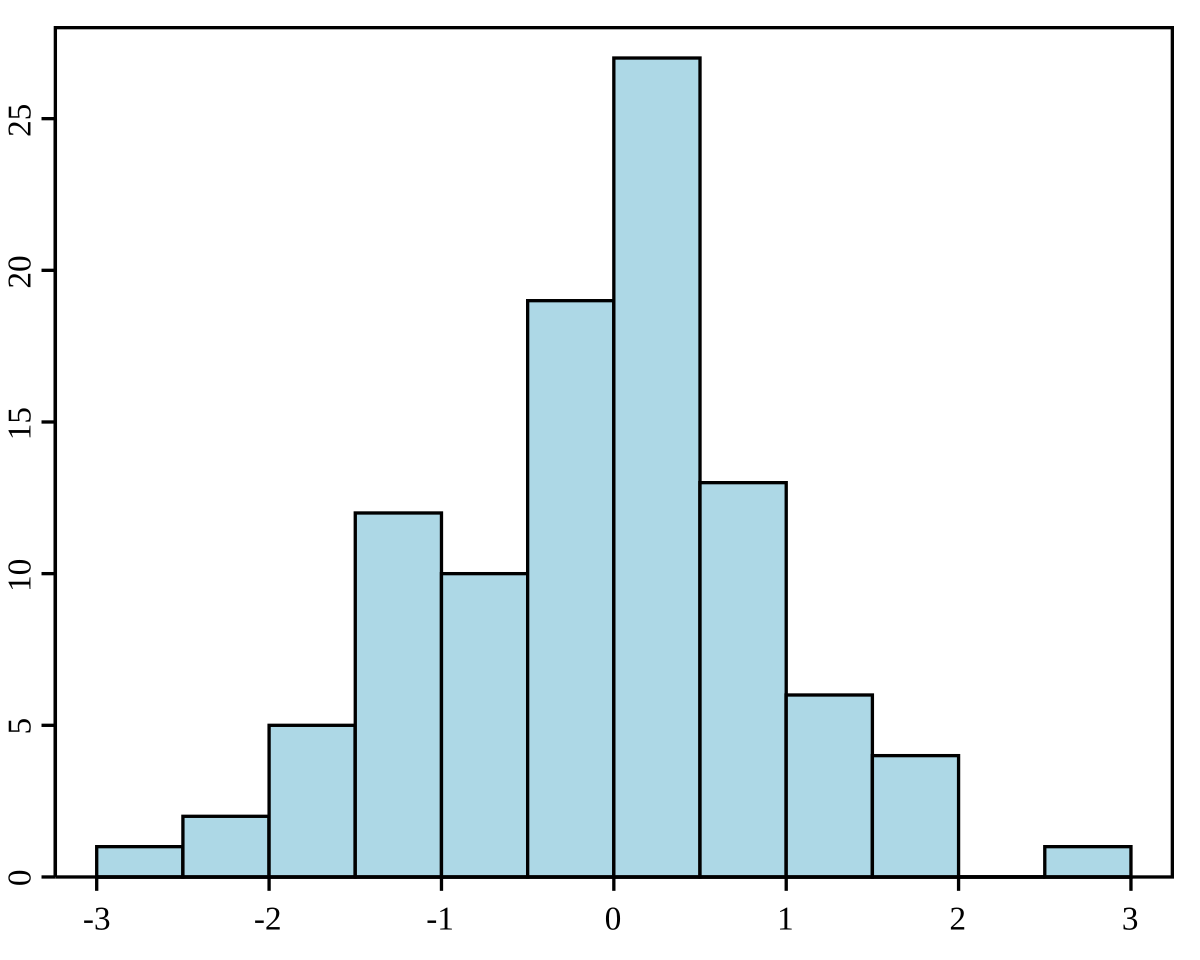
Histogram: A histogram is a form of representation like the bar graph, but it is used for continuous class intervals. It is a graphical representation of a grouped frequency distribution with continuous classes. Unlike a bar graph, the width of the bar plays a significant role in its construction.
In a histogram, the areas of the rectangles erected are proportional to the corresponding frequencies. However, since the widths of the rectangles are all equal, the lengths of the rectangles are proportional to the frequencies.

Frequency Polygon: A frequency polygon is a form of representation that is drawn by joining the mid-points of the upper sides of the adjacent rectangles of a histogram. A frequency polygon graph is a line graph that represents cumulative frequency distribution data.
Although frequency polygons are drawn with a histogram, they can also be drawn independently without histograms. This can be done by joining the mid-points of the class intervals used in the data. These mid-points of the class intervals are called class marks.
Besides referring to NCERT solutions to help solve the problems, students should also have reliable study materials to learn and practice their concepts. Embibe provides 3D videos, practice questions, and mock tests to help students prepare thoroughly. Click on the links in the table below to start the exam preparation right away:
| NCERT Class 9 Maths Ex.14.3 Study Materials | Links |
|---|---|
| Book | NCERT Class 9 Maths Book |
| Practice Questions | NCERT Class 9 Maths Ex.14.3 Questions |
| Mock Tests | NCERT Class 9 Maths Ex.14.3 Test |
Here are the most frequently asked questions about NCERT Solutions for Statistics Exercise 14.3 Class 9 Maths:
Ans: Students can find the NCERT solutions for Ex 14.3 Class 9 on Embibe.
Ans: Yes, NCERT solutions for Class Maths provided by Embibe are sufficient to prepare for CBSE Class 9 exams. Each and every exercise of all the chapters have been explained and solved in a comprehensive manner.
Ans: Students can practice questions on Embibe for NCERT Class 9 Maths Exercise 14.3.
Ans: Students can take mock tests for the NCERT Class 9 Maths Exercise 14.3 on Embibe.
Ans: The Exercise 14.3 of Class 9 Maths discusses about Graphical Representation of Data in Statistics.
Also, Check,
We hope this article on NCERT Solutions for Statistics Exercise 14.3 Class 9 Maths was helpful to you.
Stay tuned to Embibe for more updates on CBSE Class 9 Maths, exam tips, and the latest academic articles!