


Ellipse: Do you know the orbit of planets, moon, comets, and other heavenly bodies are elliptical? Mathematics defines an ellipse as a plane curve surrounding...
Last Modified 14-04-2025

Harvest Smarter Results!
Celebrate Baisakhi with smarter learning and steady progress.
Unlock discounts on all plans and grow your way to success!

Ellipse: Definition, Properties, Applications, Equation, Formulas
April 14, 2025
Altitude of a Triangle: Definition & Applications
April 14, 2025
Manufacturing of Sulphuric Acid by Contact Process
April 13, 2025
Refining or Purification of Impure Metals
April 13, 2025
Pollination and Outbreeding Devices: Definition, Types, Pollen Pistil Interaction
April 13, 2025
Acid Rain: Causes, Effects
April 10, 2025
Congruence of Triangles: Definition, Properties, Rules for Congruence
April 8, 2025
Complementary and Supplementary Angles: Definition, Examples
April 8, 2025
Nitro Compounds: Types, Synthesis, Properties and Uses
April 8, 2025
Bond Linking Monomers in Polymers: Biomolecules, Diagrams
April 8, 2025
Properties of Regression Coefficients: Regression coefficients are important in statistics. Regression is a functional relationship between two variables, one of which could be the cause and the other an effect. The coefficients are a statistical measure used to determine the average relationship between variables. Here, one variable is a dependent variable, and the other is an independent variable.
It also evaluates the degree to which one variable is dependent on another. Regression coefficients also analyse how dependent one variable is on the others. Correlations have three distinct characteristics. They can provide information about the direction, shape, and degree (strength) of the relationship between two variables. Let us learn more about the properties of regression coefficients.

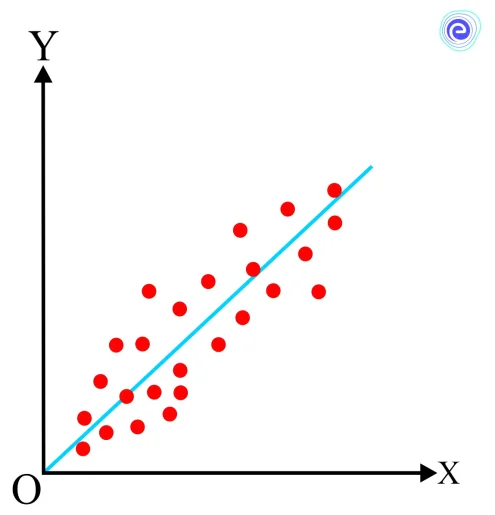
The quantities multiplied by the variables in a regression equation are called regression coefficients. Linear regression is the most common type of regression. The goal of linear regression is to determine which regression coefficients provide the best-fitting line.
In linear regression, the regression coefficients assist in estimating the value of an unknown variable using a known variable. The regression coefficients analyse how the variables are dependent on other.
Regression analysis is a proven way of determining which variables impact a particular issue. It allows you to confidently establish which elements are most important, which factors may be ignored, and how they interact.
To completely understand regression analysis, you must first understand the following terms:
By calculating the equation of the best-fitted straight line, linear regression can quantify how a unit change in an independent variable generates an effect in the dependent variable.
We need to find the equation of the best-fitted line before finding the regression coefficients to check whether the variables are in a linear relationship. This process is known as regression analysis. The steps to find the regression coefficients are listed below:
PRACTICE EXAM QUESTIONS AT EMBIBE
Regression coefficients calculate the slope of the line, which is the change in the independent variable for a unit change in the variable. As a result, they’re often referred to as the slope coefficient. The equation for the linear regression line is \(Y = a + bX\). The regression coefficient is \(b\), and the constant is \(a\). It is expressed as an individual data unit. Some of the properties of regression coefficients are listed below:
Property 1:
When two variables, such as \(X\) and \(Y\), are present, two regression coefficient values are obtained. When \(X\) is independent and \(Y\) is dependent, we get one solution. When \(Y\) is independent and \(X\) is dependent, we get another solution.
Here, if \(b_{YX}\) is positive, \(b_{XY}\) is positive as well, and if \(b_{YX}\) is negative, \(b_{XY}\) is negative.
Property 2:
The regression coefficients change due to a change in scale (shift of scale), but they do not change due to a shift of origin. It indicates that subtracting any constant from the value of \(X\) and \(Y\) does not influence the regression coefficients. The regression coefficient will change if \(X\) and \(Y\) are multiplied by any constant.
Property 3:
The point of intersection of the two lines of regression is \(\left( {\bar x,\bar y} \right)\). This point is also the solution for the both lines of regression: \(y\) on \(x\) and \(x\) on \(y\).
Property 4:
The coefficient of correlation is equal to the geometric mean of the two regression coefficients of the two variables \(X\) and \(Y\). The common sign of the regression coefficients would be the sign of the correlation coefficient. This property states that if the two regression coefficients are represented \(b_{YX}\) and \(b_{XY}\), then the correlation coefficient is given by
\(r = \pm \sqrt {{b_{xy}} \times {b_{yx}}} \)
Here, if both regression coefficients are negative, \(r\) will be negative, and if they are both positive, \(r\) will be positive.

Property 5:
If one regression coefficient is more than one, the other must be lesser than one.
Property 6:
When \(r = – 1\) or \(+1\), in other words, when there is a perfect negative or positive correlation between the two variables, the two lines of regression coincide or become identical.
Property 7:
When \(r = 0\), the two regression lines are perpendicular to each other.
Property 8:
The arithmetic mean (AM) of both regression coefficients is equal to or greater than the correlation coefficient.
\(\frac{{{b_{YX}}\; + \;{b_{XY}}}}{2} \geqslant r\)
Understanding the nature of the regression coefficient is crucial since it aids in making specific predictions about the unknown variable. It can be used to see how much dependent variable changes when the independent variable is changed by one unit. The regression coefficients’ interpretation is given below.
Below are a few solved examples that can help in getting a better idea.
Q.1. Find the regression coefficients for the data given below:
| Age | Glucose Level |
| \(43\) | \(99\) |
| \(21\) | \(65\) |
| \(25\) | \(79\) |
| \(42\) | \(75\) |
| \(57\) | \(87\) |
| \(59\) | \(81\) |
Ans:
From the given data,
| Age \((x)\) | Glucose Level \((y)\) | \(xy\) | \(x^2\) | \(y^2\) |
| \(43\) | \(99\) | \(4257\) | \(1849\) | \(9801\) |
| \(21\) | \(65\) | \(1365\) | \(441\) | \(4225\) |
| \(25\) | \(79\) | \(1975\) | \(625\) | \(6241\) |
| \(42\) | \(75\) | \(3150\) | \(1764\) | \(5625\) |
| \(57\) | \(87\) | \(4959\) | \(3249\) | \(7569\) |
| \(59\) | \(81\) | \(4779\) | \(3481\) | \(6561\) |
| Total \(= 247\) | \(486\) | \(20485\) | \(11409\) | \(40022\) |
We know that, the regression equation is \(Y = bX + a\)
Where, \(a\) and \(b\) are regression coefficients.
\(b = \frac{{n\left( {\sum xy} \right) – \left( {\sum x} \right)\left( {\sum y} \right)}}{{n\sum {x^2} – {{\left( {\sum x} \right)}^2}}}\)
\( \Rightarrow b = \frac{{6\left( {20485} \right) – \left( {247} \right) \times \left( {486} \right)}}{{6 \times 11409 – {{\left( {247} \right)}^2}}}\)
\( \Rightarrow b = \frac{{122910 – 120042}}{{68454 – 61009}}\)
\( \Rightarrow b = \frac{{2868}}{{7445}}\)
\(\therefore \,b = 0.385\)
\(a = \frac{{\left( {\sum y} \right)\left( {\sum {x^2}} \right) – \left( {\sum x} \right)(\sum xy)}}{{n\sum {x^2} – {{\left( {\sum x} \right)}^2}}}\)
\( \Rightarrow a = \frac{{486 \times 11409 – \left( {247} \right) \times \left( {20485} \right)}}{{6 \times 11409 – {{\left( {247} \right)}^2}}}\)
\( \Rightarrow a = \frac{{5544774 – 5059795}}{{68454 – 61009}}\)
\( \Rightarrow a = \frac{{484979}}{{7445}}\)
\(\therefore \,a = 65.1415\)
Hence, the regression coefficients are \(b = 0.385\) and \(a = 65.142\).
Q.2. The regression equations for the variables \(x\) and \(y\) are \(7x – 3y – 18 = 0\) and \(4x – y – 11 = 0\), respectively. Find the arithmetic mean of \(x\) and \(y\)
Ans:
Given: regression equations are
\(7x\;–\;3y\;–\;18\; = \;0\) —–(i)
\(4x\;–\;y\;–\;11\; = \;0\) —–(ii)
\(y = 4x – 11\) —–(iii)
Substituting the above value in equation (i),
\(7x – 3\left( {4x – 11} \right) – 18 = 0\)
\(7x – 12x + 33 – 18 = 0\)
\( – 5x + 15 = 0\)
\( – 5x = – 15\)
\(x = \frac {15}{5}\)
\(\therefore\; x = 3\)
From (iii),
\( y = 4(3) – 11\)
\( y = 12 – 11\)
\(\therefore\; y = 1\)
By the property of regression coefficients, we know that the intersection point of two regression equations is (mean of \(‘x’\), mean of \(‘y’\)).
By solving, we got the intersection point as \((3, 1)\)
Hence, the mean of \(x = 3\) and mean of \(y = 1\).
Q.3. The regression coefficient of the regression equation of \(X\) on \(Y\)is \(2.4\), and the regression coefficient for the same regression equation of \(Y\) on \(X\) is \(0.8\). Check whether the regression coefficients are consistent or not?
Ans:
Given: The regression coefficient of \(X\) on \(Y\) is \((b_{XY}) = 2.4\)
The regression coefficient of \(Y\) on \(X\) is \((b_{YX}) = 0.8\)
According to the property of regression coefficients,
\({r^2} = {b_{XY}} \times {b_{YX}}\)
\({r^2} = 2.4 \times 0.8\)
\(\therefore \,{r^2} = 1.92\)
Here, the correlation coefficient \(r^2\) is greater than \(1\).
We know that, \({r^2} \leqslant 1\)
So, the given value does not satisfy the condition.
Hence, the given regression coefficients are not consistent.
Q.4. Find the regression equation of the line for the following data.
| \(A\) | \(B\) |
| \(6.25\) | \(4.03\) |
| \(6.2\) | \(4.02\) |
| \(6.2\) | \(4.02\) |
| \(6\) | \(4.04\) |
| \(6.25\) | \(4.03\) |
| \(6.25\) | \(4.03\) |
Ans:
| \(X\) | \(Y\) | \(XY\) | \(X^2\) | \(Y^2\) |
| \(6.25\) | \(4.03\) | \(25.19\) | \(39.06\) | \(16.24\) |
| \(6.5\) | \(4.02\) | \(26.13\) | \(42.25\) | \(16.16\) |
| \(6.5\) | \(4.02\) | \(26.13\) | \(42.25\) | \(16.16\) |
| \(6\) | \(4.04\) | \(24.24\) | \(36\) | \(16.32\) |
| \(6.25\) | \(4.03\) | \(25.19\) | \(39.06\) | \(16.24\) |
| \(6.25\) | \(4.03\) | \(25.19\) | \(39.06\) | \(16.24\) |
| Total \(= 37.75\) | \(24.17\) | \(152.06\) | \(237.69\) | \(97.37\) |
\(b = \frac{{n\left( {\sum xy} \right) – \left( {\sum x} \right)\left( {\sum y} \right)}}{{n\sum {x^2} – {{\left( {\sum x} \right)}^2}}}\)
\( \Rightarrow b = \frac{{6\left( {152.06} \right) – \left( {24.17} \right) \times \left( {37.75} \right)}}{{6 \times 237.69 – {{\left( {37.75} \right)}^2}}}\)
\(\therefore \,b = – 0.04\)
\(a = \frac{{\left( {\sum y} \right)\left( {\sum {x^2}} \right) – \left( {\sum x} \right)(\sum xy)}}{{n\sum {x^2} – {{\left( {\sum x} \right)}^2}}}\)
\( \Rightarrow a = \frac{{24.17 \times 237.69 – \left( {37.75} \right) \times \left( {152.06} \right)}}{{6 \times 237.69 – {{\left( {37.75} \right)}^2}}}\)
\(\therefore \,a = 4.28\)
The regression equation is \(Y = bX + a\)
Hence, the regression equation is \(Y = – 0.04 X + 4.28\)
Q.5. Find the correlation coefficient between \(X\) and \(Y\) for the equations \(7x – 3y – 18 = 0\) and \(4x – y – 11 = 0\).
Ans:
Assume that the regression line of \(y\) on \(x\) is \(7x – 3y – 18 = 0\) and that the regression line of \(x\) on \(y\) is \(4x – y – 11 = 0\).
Given: \(7x – 3y – 18 = 0\)
\(y = \frac{1}{3}\left( {7x – 18} \right)\)
\(\therefore \,y = \frac{7}{3}x – 6\)
So, \(b_{YX} = \frac {7}{3}\)
Given, \(4x – y – 11 = 0\)
\(4x = y + 11\)
\(\therefore \,x = \frac{1}{4}y + \frac{{11}}{4}\)
So, \(b_{XY} = \frac {1}{4}\)
The correlation coefficient is given by
\(r = \sqrt {{b_{YX}} \times {b_{XY}}} \)
\(r = \sqrt {\frac{7}{3} \times \frac{1}{4}} \)
\(\therefore \,r = 0.7638\)
Hence, the correlation coefficient is \(0.7638\).

Regression coefficients are a statistical measure for determining the average functional relationship between the variables. Here, one variable is independent, and the other variable is dependent. It also evaluates the extent to which one variable is dependent on the others. The slope of the line is the change in the independent variable for a unit change in the independent variable, which is determined by regression coefficients.
As a result, they’re also called the slope coefficient. They are divided into three groups, such as simple partial and many, positive and negative, and linear and non-linear. In the linear regression, the line is given by the equation \(Y = bX + a\). Here \(a\) is a constant, and \(b\) is the regression coefficient.
Students might be having many questions with respect to the Properties of Regression Coefficients. Here are a few commonly asked questions and answers.
Q.1. What is the product of regression coefficients?
Ans: The product of the regression coefficient of \(y\) on \(x\) and the regression coefficient of \(x\) on \(y\) is always less than or equal to \(1\).
\({b_{XY}} \times {b_{YX}} \leqslant 1\), where \({b_{XY}}\) and \({b_{YX}}\) are regression coefficients.
Q.2. What are the limits of correlation coefficients?
Ans: The range of coefficient values is \(+1\) to \(-1\), with \(+1\) indicating a perfect positive association, \(-1\) indicating a perfect negative relationship, and \(0\) indicating no relationship.
Q.3. What is the symbol used for regression coefficient?
Ans: The Greek letter beta \((\beta)\) represents a standardised regression coefficient, while a lowercase \(b\) represents an unstandardised regression coefficient.
Q.4. What is the regression coefficient formula?
Ans: The formulas regression coefficient is given by
Q.5. Can a regression coefficient be greater than \(1\)?
Ans: If one regression coefficient exceeds \(1\) the other must be less than \(1\), but not greater than \(1\).
We hope this information about the Properties of Regression Coefficients has been helpful. If you have any doubts, comment in the section below, and we will get back to you.


