


Ellipse: Do you know the orbit of planets, moon, comets, and other heavenly bodies are elliptical? Mathematics defines an ellipse as a plane curve surrounding...
Last Modified 14-04-2025

Harvest Smarter Results!
Celebrate Baisakhi with smarter learning and steady progress.
Unlock discounts on all plans and grow your way to success!

Ellipse: Definition, Properties, Applications, Equation, Formulas
April 14, 2025
Altitude of a Triangle: Definition & Applications
April 14, 2025
Manufacturing of Sulphuric Acid by Contact Process
April 13, 2025
Refining or Purification of Impure Metals
April 13, 2025
Pollination and Outbreeding Devices: Definition, Types, Pollen Pistil Interaction
April 13, 2025
Acid Rain: Causes, Effects
April 10, 2025
Congruence of Triangles: Definition, Properties, Rules for Congruence
April 8, 2025
Complementary and Supplementary Angles: Definition, Examples
April 8, 2025
Nitro Compounds: Types, Synthesis, Properties and Uses
April 8, 2025
Bond Linking Monomers in Polymers: Biomolecules, Diagrams
April 8, 2025
Statistics Formulas: Statistics is a branch of mathematics that deals with data gathering, organisation, analysis, interpretation, and presentation. It enables us to comprehend a variety of outcomes and foresee a wide range of possibilities. Statistics is concerned with facts, observations, and information that are just numerical data. Statistics formulas make arithmetical calculation fast, less prone to error and make a task easier.
We can obtain multiple measures of central tendency and the deviation of distinct values from the centre using statistics. We can use statistics to examine data in various domains to track evolving patterns, and then utilise the results to develop conclusions and forecasts. Let us learn about the statistics formulas Class 10 with their examples.

Statistics is a discipline of mathematics that deals with data analysis and numbers. The study of data collection, analysis, interpretation, presentation, and organisation is known as statistics.
Statistics is concerned with gathering, classifying, organising, and presenting numerical data in a given context. It enables us to analyse a range of data. The classification of statistics is given below:
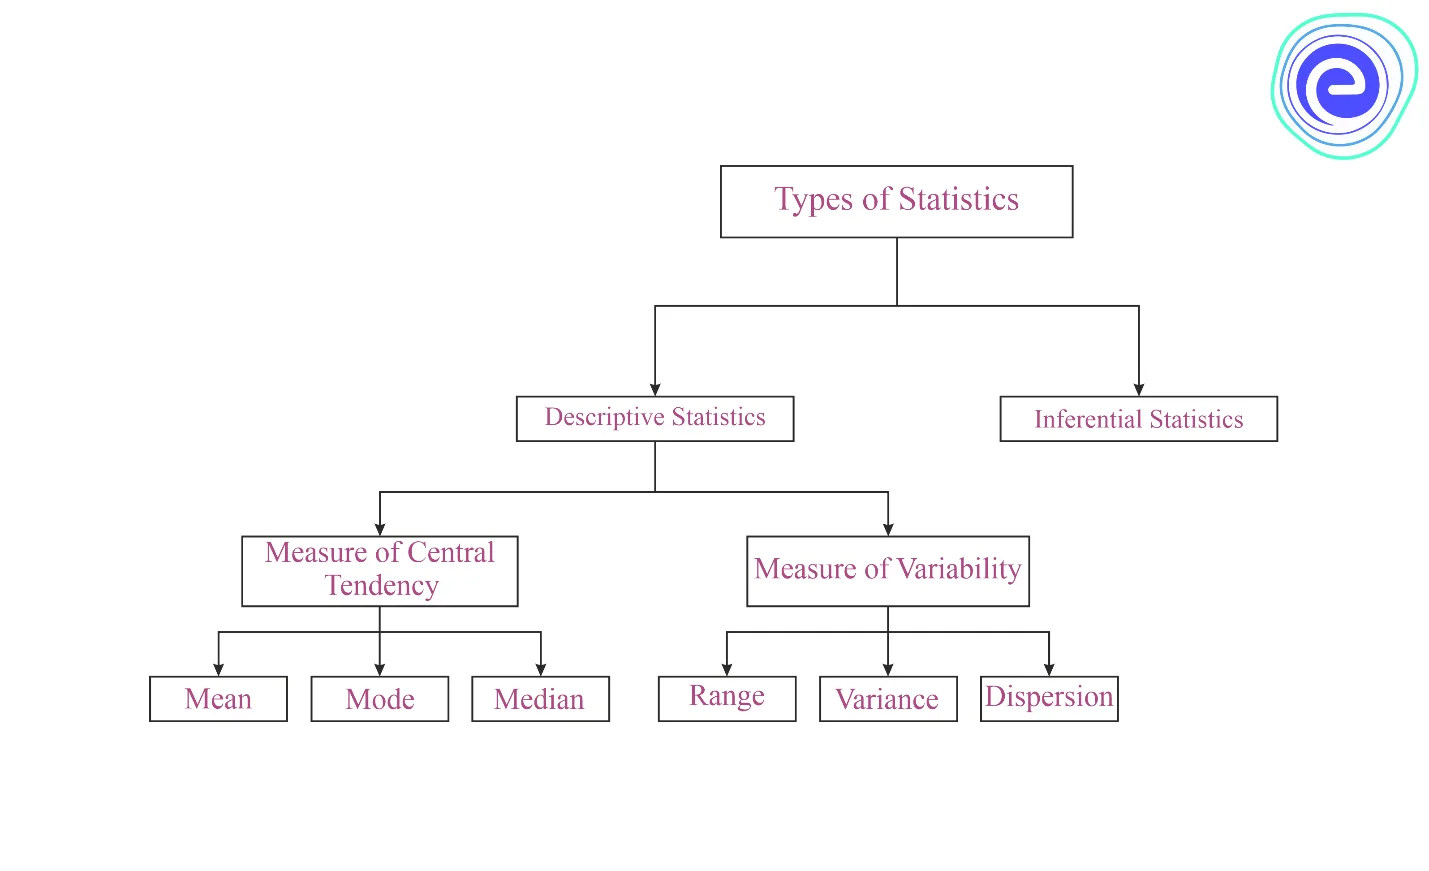
The basic notions of mean, median, mode, variance, and standard deviation are the stepping stones for practically all statistical computations. Let us explore basic statistics all formulas Class 10 in detail.
The ratio of the sum of all observations to the total number of observations in a data set is known as the mean.
For ungrouped data:
Mean \( = \overline x = \frac{{\sum\limits_{i = 1}^n {{x_i}} }}{n}\)
Where, \(\overline x = \) mean
\({x_i} = {i^{{\rm{th}}}}\) data or observation
\(n = \)number of data or observation
Similarly, for grouped data
Mean \( = \overline x = \frac{{\sum\limits_{i = 0}^n {{x_i}{f_i}} }}{N}\)
Where, \(\overline x = \) mean
\({x_i} = {i^{{\rm{th}}}}\) data or observation
\({f_i} = \)frequency of \({x_i}\)
\(N = \sum\limits_{i = 0}^n {{f_i} = } \)Total number of frequency
The middle number or centre value in a set of data is called the median. The midpoint of the set is also known as the median. To find the median, arrange the data in ascending/ descending order from least to greatest or greatest to least value. A median is a number that separates the upper and lower halves of a data sample, population, or probability distribution.
For ungrouped data:
If the total number of observations is odd, the median is calculated using the following formula:
Median \( = {\left\{ {\frac{{\left( {n + 1} \right)}}{2}} \right\}^{{\rm{th}}}}\) term
If the total number of observations is even, the median is calculated using the following formula:
Median \( = \frac{{{{\left\{ {\frac{n}{2}} \right\}}^{{\rm{th}}}}{\rm{term}} + {{\left\{ {\frac{n}{2} + 1} \right\}}^{{\rm{th}}}}{\rm{term}}}}{2}\)
Similarly, for grouped data:
Median \( = l + \left( {\frac{{\frac{N}{2} – c}}{f}} \right) \times h\)
Where,
\(l = \)lower limit of the median class
\(c = \)cumulative frequency of the class preceding the median class
\(f = \)frequency of the median class
\(N = \)total number of frequency
\(h = \)height of the median class
In a data set, the mode of data is the observation with the highest frequency. But It is not possible to calculate the mode of a grouped frequency distribution simply by looking at the frequency. In such circumstances, the modal class is used to determine the mode of the data. The modal class contains the mode property. The formula for determining the data mode is
Mode \( = l + \left( {\frac{{{f_1} – {f_0}}}{{2\,{f_1} – {f_0} – {f_2}}}} \right) \times h\)
Where,
\(l = \)lower limit of the modal class
\({f_0} = \)frequency of the class preceding the modal class
\({f_1} = \)frequency of the modal class
\({f_2} = \)frequency of the class succeeding the modal class
\(h = \)height of the modal class
There is one empirical formula among mean, median and mode is
\({\rm{Mean}} – {\rm{Mode}} = 3\left( {{\rm{Mean}} – {\rm{Median}}} \right)\)

The difference between the highest and lowest values among the given data set is called range.
\({\rm{Range}} = {\rm{Maximum}}\,{\rm{value}} – {\rm{Minimum}}\,{\rm{value}}\)
A statistical measure of the average deviation of data in a sample from the centre value is the mean deviation.
For grouped data:
Mean deviation \( = M.D.\left( A \right) = \frac{{\sum\limits_{i = 0}^n {\left| {{x_i} – A} \right|} }}{n}\)
Where,
\(M.D.\left( A \right) = \) Mean deviation about \(A\)
\(A = \) Mean/Median/Mode
\(n = \) number of data or observation
The variance of data points is a measure of how they differ from the mean. The higher the value of variance, the more scattered the data is from its mean, and the lower the value of variance, the less scattered the data is from its mean. The expectation of a random collection of data’s squared variation from its mean value is called variance.
Variance \( = Var\left( X \right) = {\sigma ^2} = E\left[ {{{\left( {X – \mu } \right)}^2}} \right] = \frac{{\sum\limits_{i = 0}^n {{{\left( {{x_i} – \mu } \right)}^2}} }}{n}\)
Where,
\(\mu = E\left( X \right) = \) mean of the given data
\({x_i} = {i^{{\rm{th}}}}\)data or observation
\(n = \) number of data or observation
There is one more formula of variance on simplification –
Variance\( = Var\left( X \right) = {\sigma ^2} = E\left( {{X^2}} \right) – {\left( \mu \right)^2} = \frac{{\sum\limits_{i = 0}^n {{{\left( {{x_i}} \right)}^2}} }}{n} – {\left( {\frac{{\sum\limits_{i = 0}^n {{x_i}} }}{n}} \right)^2}\)
A standard deviation is a statistic that measures a dataset’s dispersion from its mean. The standard deviation is the positive square root of variance. The formula used to find the standard deviation is
\(S.D. = \sigma = \sqrt {\frac{{\sum {{{\left( {{x_i} – \mu } \right)}^2}} }}{N}} \)
\(N = \)Total number of frequency
Here are a few examples of how statistics are used in everyday life.
1. All medical research relies on statistics. Doctors use statistics to keep track of where the infant should be in terms of mental development. Doctors also use statistics to assess the efficacy of treatments.
2. For observation, analysis, and mathematical prediction models, statistics are critical. To forecast future weather conditions, weather forecast models are constructed utilising data that compare previous weather conditions with current weather circumstances.
3. Every day, a corporation produces thousands of products and ensures that only the highest-quality things are sold. It is impossible for a corporation to test each product. As a result, the organisation employs statistically-based quality testing.
4. For stock analysis, the stock market also employs statistical computer models. Stock analysts use statistical techniques to gather information about the economy.
5. Retailers use statistics to keep track of everything they sell and to maintain track of their inventories. Leading retailers around the world utilise analytics to determine which products ship to which stores and when.
Q.1. What will be the mean of the following data: 2,10,3,5,3,11,32,23,12,7
Ans: Mean \( = \overline x = \frac{{\sum\limits_{i = 0}^n {{x_i}} }}{n} = \frac{{2 + 10 + 3 + 5 + 3 + 11 + 32 + 23 + 12 + 7}}{{10}} = \frac{{108}}{{10}} = 10.8\)
Q.2. Find the median in the following data.
5,3,12,0,7,11,4,3,8
Ans: On arranging the given data in ascending order, we get \(0,\,3,\,3,\,4,\,5,\,7,\,8,\,11,\,12\)
The total number of observations \( = n = 9,\) which is odd.
Median \( = {\left( {\frac{{n + 1}}{2}} \right)^{{\rm{th}}}}\) observation
\( = \frac{{9 + 1}}{2} = 5\)
\({5^{{\rm{th}}}}\) observation, which is \(5.\)
Hence, the median is \(5.\)
Q.3. The number of goals scored by a football team in a series of matches is 3,1,0,7,5,3,3,4,1,2,0,2. Find the median of the data.
Ans: Arranging the number of goals in ascending order, we get,
\(0,\,0,\,1,\,1,\,2,\,2,\,3,\,3,\,3,\,4,\,5,\,7\)
Here, \(n = 12\)
Median \( = \frac{{{{\left( {\frac{n}{2}} \right)}^{{\rm{th}}}}{\rm{observation}} + {{\left( {\frac{n}{2} + 1} \right)}^{{\rm{th}}}}{\rm{observation}}}}{{2}}\)
\( = \frac{{{{\left( 6 \right)}^{{\rm{th}}}}{\rm{observation}} + {{\left( 7 \right)}^{{\rm{th}}}}{\rm{observation}}}}{2} = \frac{{2 + 3}}{2} = 2.5\)
Hence, the median of the data is \(2.5.\)
Q.4. Calculate the mean deviation from the mean for the following data:
4,7,8,9,10,12,13,17
Ans: Let \(\overline x \) be the mean of the given data.
\(\overline x = \frac{{4 + 7 + 8 + 9 + 10 + 12 + 13 + 17}}{8} = 10\)
| \({x_i}\) | \(\left| {{d_i}} \right| = \left| {{x_i} – \overline x } \right|\) |
| \(4\) | \(6\) |
| \(7\) | \(3\) |
| \(8\) | \(2\) |
| \(9\) | \(1\) |
| \(10\) | \(0\) |
| \(12\) | \(2\) |
| \(13\) | \(3\) |
| \(17\) | \(7\) |
| Total | \(24\) |
We know, \(MD = \frac{1}{n}\sum\limits_{i = 1}^n {\left| {{d_i}} \right|} \)
\(\therefore MD = \frac{1}{8} \times 24 = 3\)
Q.5. Find the standard deviation and variance for the following data:
| \(x:\) | \(3\) | \(8\) | \(13\) | \(18\) | \(23\) |
| \(f:\) | \(7\) | \(10\) | \(15\) | \(10\) | \(6\) |
Ans:
| \({x_i}\) | \({f_i}\) | \({f_i}{x_i}\) | \({f_i}{x_i}^2\) |
| \(3\) | \(7\) | \(21\) | \(63\) |
| \(8\) | \(10\) | \(80\) | \(640\) |
| \(13\) | \(15\) | \(195\) | \(2535\) |
| \(18\) | \(10\) | \(180\) | \(3240\) |
| \(23\) | \(6\) | \(138\) | \(3174\) |
| \(N = 48\) | \(\sum {{f_i}{x_i}} = 614\) | \({\sum {{f_i}{x_i}} ^2} = 9652\) |
Standard deviation \(\left( \sigma \right) = \sqrt {\frac{{\sum {{f_i}{x_i}^2} }}{N} – {{\left( {\frac{{\sum {{f_i}{x_i}} }}{N}} \right)}^2}} \)
SD, \(\left( \sigma \right) = \sqrt {201.08 – {{\left( {12.79} \right)}^2}} \)
\( = \sqrt {201.08 – 163.58} = \sqrt {37.49} = 6.12\)
Variance \(\left( {{\sigma ^2}} \right) = 37.49\)
In this article, we have learnt about Statistics, formulas & solved examples and their application in real life. Statistics play a significant role in our daily lives. We can assist people with statistics word problems so that they can grasp the importance of statistics in everyday life.
Statistics are widely used in the field of medical studies, weather forecasts, quality testing, stock market etc. We can learn about what happened in the past and what might happen in the future by using statistics.

Here are some of the commonly asked questions about statistics formulas:
Q.1: How to remember statistics formulas?
Ans: In order to remember the statistics formulas, we need to continue practising a lot of questions daily. Doing a lot of problems regularly will help to remember the statistics formulas.
Q.2: What is the mode formula in statistics?
Ans: In a set of data, the mode of data is the observation with the highest frequency. But It is not possible to calculate the mode of a grouped frequency distribution simply by looking at the frequency. In such circumstances, the modal class is used to determine the mode of the data. The modal class contains the mode property. The formula for determining the data mode is
Mode \( = l + \left( {\frac{{{f_1} – {f_0}}}{{2\,{f_1} – {f_0} – {f_2}}}} \right) \times h\)
Q.3: How to calculate consistency in the statistics formula?
Ans: Data consistency can be defined in a variety of ways, including stability, uniformity, and consistency. Statistics like the range, variance, and standard deviation are common gauges of data consistency. The standard error of the mean is frequently checked when analysing the consistency of data taken from a population sample.
Q.4: How to calculate the median in statistics using formula?
Ans: To find the median, arrange the data in ascending order from least to greatest or greatest to least value. A median is a number that separates the upper and lower halves of a data sample, population, or probability distribution.
If the total number of observations is odd, the median is calculated using the following formula:
Median \( = {\left\{ {\frac{{\left( {n + 1} \right)}}{2}} \right\}^{{\rm{th}}}}\) term
If the total number of observations is even, the median is calculated using the following formula:
Median \( = \frac{{{{\left\{ {\frac{n}{2}} \right\}}^{{\rm{th}}}}{\rm{term}} + {{\left\{ {\frac{n}{2} + 1} \right\}}^{{\rm{th}}}}{\rm{term}}}}{2}\)
Q.5: What is the formula for standard deviation in statistics?
Ans: A standard deviation is a statistic that measures a dataset’s dispersion from its mean. The standard deviation is the positive square root of variance. The formula used to find the standard deviation is
\(S.D. = \sigma = \sqrt {\frac{{\sum {{{\left( {{x_i} – \mu } \right)}^2}} }}{N}} \)
We hope this detailed article on the statistics formulas helps you. If you have any queries regarding this article, reach out to us through the comment section below and we will get back to you as soon as possible.
Stay tuned to Embibe for more notifications on Statistics Formulas and other similar topics.


