


Ellipse: Do you know the orbit of planets, moon, comets, and other heavenly bodies are elliptical? Mathematics defines an ellipse as a plane curve surrounding...
Last Modified 14-04-2025

Harvest Smarter Results!
Celebrate Baisakhi with smarter learning and steady progress.
Unlock discounts on all plans and grow your way to success!

Ellipse: Definition, Properties, Applications, Equation, Formulas
April 14, 2025
Altitude of a Triangle: Definition & Applications
April 14, 2025
Manufacturing of Sulphuric Acid by Contact Process
April 13, 2025
Refining or Purification of Impure Metals
April 13, 2025
Pollination and Outbreeding Devices: Definition, Types, Pollen Pistil Interaction
April 13, 2025
Acid Rain: Causes, Effects
April 10, 2025
Congruence of Triangles: Definition, Properties, Rules for Congruence
April 8, 2025
Complementary and Supplementary Angles: Definition, Examples
April 8, 2025
Nitro Compounds: Types, Synthesis, Properties and Uses
April 8, 2025
Bond Linking Monomers in Polymers: Biomolecules, Diagrams
April 8, 2025
Ungrouped Data: When a data collection is vast, a frequency distribution table is frequently used to arrange the data. A frequency distribution table provides the data values as well as the number of occurrences of each value in the data collection. A frequency distribution table is simple to read and analyse, and it is employed in this idea for ungrouped or listed data. The numbers in a frequency distribution table do not have to be arranged in any particular sequence. A tally column is frequently added to tables to make it easier to enter figures.
Inserting a tally column allows you to account for every value in the data set without having to constantly check the numbers in the list to discover them. The existence of a value in the list is represented by a slash (/), and the total number of slashes is the frequency. If a tally column is added, the table will have three columns; if no tally column is included, the table will have two columns.

Data is a collection of information assembled by observations, research measurements, or analysis. In a table, there are two essential columns required, namely, the observation and frequency. In addition, we can find the mean, median, mode, and mean deviation for ungrouped data. There are grouped and ungrouped data. In this article, we will discuss the properties, and applications of ungrouped data one by one.
The data which are obtained from direct observation is called raw data or ungrouped data. The marks of ten students in a monthly test are an example of raw data.
Consider the marks obtained by 10 students in a mathematics test as given below:
| 55 36 95 73 60 42 25 78 75 62 |
The data is in the form of raw data. By observing the given format, can we find the highest and the lowest marks?
Is it not time-consuming? Wouldn’t it be less time taking if these marks are arranged in ascending or descending order?
So let us arrange the marks in ascending order as
| 25 36 42 55 60 62 73 75 78 95 |
Now, we can see that the lowest mark is \(25\) and the highest mark is \(95\).
The difference between the highest value and the lowest value is known as the class range.
Presenting the data in ascending and descending order can be time-consuming if large data are given.
In tabular representation of ungrouped data, two attributes are needed, such as observations, and frequency.
Observation
Each numerical figure of data is known as an observation.
Frequency
The number of times a particular observation occurs is called its frequency.
For example, consider the marks of \(30\) students of a class.
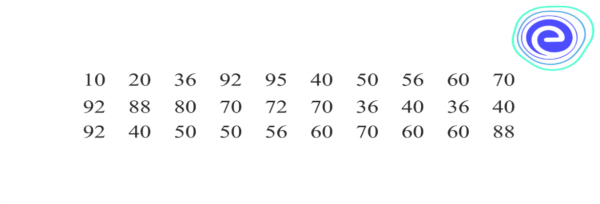
Here, the number of students who have obtained a certain number of marks is called the frequency of those marks. \(4\) students got \(60\). So, the frequency of marks \(60\) is \(4\).
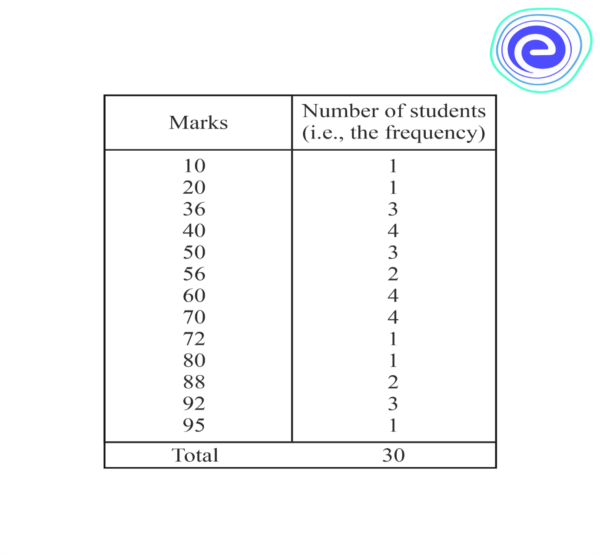
This table is an ungrouped frequency distribution table.
The measure of central tendency is a value that aims to define a set of data by recognizing the central position within that data set. The mean, median, and mode are the measures of central tendency.
Arithmetic mean in statistics defines the measurement of average and determines the central tendency of data. In other words, to evaluate the mean of a set of data, add all the observations and then divide this total by the number of observations. The mathematical symbol or notation for average is \(\bar{x}\), read as \(x\) bar.
The mean of the ungrouped data can be calculated using the following formula when the data are raw.
The mean of \(n\) observations (variables) \(x_{1,} x_{2,} x_{3,} x_{4,} \ldots x_{n}\) is given by the formula:
Mean \(=\frac{x_{1}+x_{2}+x_{3+} x_{n}}{n}=\frac{\sum x_{i}}{n}\),
where \(\sum x_{i}=x_{1+} x_{2+} x_{3+} x_{4+} \ldots \ldots x_{n}\)
Thus, mean \(=\frac{\text { Sum of all observations }}{\text { Total number of observations }}\)
For example, The marks of \(6\) students are \(10,20,30,32,37,40\).
Therefore, the mean marks of \(6\) students
\(=\frac{10+20+30+32+37+40}{6}=\frac{159}{6}=28.17\) (approx).
The median of the distribution is the value of the variable, which divides the distribution into two equal parts, i.e., it is the value of the variable such that the number of observations above it is equal to the number of observations below it. Therefore, when the data is arranged in ascending or descending order, the median of ungrouped data is calculated as below:
When the number of observations \((n)\) is even, the median is the value of the \(\left(\frac{n}{2}\right)^{t h}\) and the \(\left(\frac{n}{2}+1\right)^{\text {th }}\) observation.
When the number of observations \((n)\) is odd, the median is the value of the \(\left(\frac{n+1}{2}\right)^{t h}\) observation.
For example, Find the median of the following values:
\(27,21,32,33,36,35,29,35,22\)
Solution: Arranging the given data in ascending order, we get
\(21,\,22,\,27,\,29,\,32,\,33,\,35,\,35,\,36\)
Here the number of observations \(n=9\) which is odd
So, Median \(=\left(\frac{n+1}{2}\right)^{t h}=\left(\frac{9+1}{2}\right)^{t h}=5^{t h}\) observation
Therefore, the median of the given data is \(36\).

A mode is that observations that occur most often, that is, the value of the observation having a maximum frequency.
Mode \(=\) Observation with the maximum frequency
For ungrouped data, we need to determine the observation which occurs maximum times.
For example, the number of employees in \(10\) different branches are as follows:
\(3,6,4,5,0,2,1,3,2,3\)
Here, \(3\) is the number of employees in the maximum number of branches. So, the mode of the data is \(3\).
Q.1: The following is the number of female employees in different branches of a private bank.
\(2, 4, 6, 1, 3, 5, 3, 6, 4, 4, 4, 2, 1, 3, 6, 4, 2, 5\)
Make a frequency distribution.
Ans: We know that each numerical figure of data is known as observation, and the number of times a particular observation occurs is called its frequency.
There are only \(1\) employee in \(2\) branches. So, the frequency of \(1\) is \(2\).
Similarly, the frequency for \(2\) is \(3\), and so on. So, the frequency distribution table is as follows:
| Number of Employees \(\left(x_{i}\right)\) | Branches \(\left(f_{i}\right)\) |
| \(1\) | \(2\) |
| \(2\) | \(3\) |
| \(3\) | \(3\) |
| \(4\) | \(5\) |
| \(5\) | \(2\) |
| \(6\) | \(3\) |
Attempt 10th CBSE Exam Mock Tests
Q.2: Find the mean of first \(5\) multiples of \(5\).
Ans: We know that the first \(5\) multiples of \(5\) are \(5,10,15,20,25\).
The sum of these multiples \(=5+10+15+20+25=75\)
Number of multiples \(=5\)
Mean \(=\frac{\text { Sum of } 5 \text { multiples }}{\text { Number of multiples }}\)
Thus,
Mean \(=\frac{5+10+15+20+25}{5}\)
\(=\frac{75}{5}=15\)
Hence, the arithmetic mean of the first \(5\) multiples of \(5\) is equal to \(15\).
Q.3: Find the mean of the following distribution:
| \(x\) | \(10\) | \(30\) | \(50\) | \(70\) | \(90\) |
| \(f\) | \(5\) | \(6\) | \(5\) | \(10\) | \(4\) |
Ans:
| \({x_i}\) | \({f_i}\) | \({x_i}{f_i}\) |
| \(10\) | \(5\) | \(10×5=50\) |
| \(30\) | \(6\) | \(30×6=180\) |
| \(50\) | \(5\) | \(50×5=250\) |
| \(70\) | \(10\) | \(70×10=700\) |
| \(90\) | \(4\) | \(90×4= 360\) |
| Total | \(\sum f_{i}=30\) | \(\sum x_{i} f_{i}=1540\) |
Now, the mean formula is
\(\bar{x}=\frac{\sum x_{i} f_{i}}{\sum f_{i}}\)
\(\Rightarrow \bar{x}=\frac{1540}{30}\)
\(\Rightarrow \bar{x}=51.33\)
Hence, the required mean is \(51.33\).
Q.4: Find the median of the following data:
\(25, 34, 31, 23, 22, 27, 35, 28, 20, 32\)
Ans: Arranging the data in ascending order, we get
\(20, 22, 23, 25, 28, 29, 31, 32, 34, 35\)
Here, the number of observations \(n=10\) is even.
So, median \(=\frac{V \text { alue of }\left(\frac{10}{2}\right)^{\text {th }} \text { observation }+\text { value of }\left(\frac{10}{2}+1\right)^{\text {th }} \text { observation }}{2}\)
Median \(=\frac{\text { Value of }(5)^{\text {th }} \text { observation }+\text { value of }(6)^{\text {th }} \text { observation }}{2}\)
\(=\frac{28+29}{2}=28.5\)
Therefore, median \(=28.5\)
Q.5: The wickets taken by a bowler in \(10\) cricket matches are as follows:
\(2, 6, 4, 5, 4, 2, 4, 3, 4, 3\)
Find the mode of the data.
Ans: A mode is that observations that occur most often, that is, the value of the observation having a maximum frequency.
Mode \(=\) Observation with the maximum frequency
\(4\) is the number of wickets taken by the bowler in the maximum number of matches. So, the mode of the data is \(4\).
This article covered the definition, examples of ungrouped data, frequency table of ungrouped data, and how to calculate the central tendency of ungrouped data i.e Mean, Median and Mode.

Q.1: What are grouped and ungrouped data? Explain with examples.
Ans: The data obtained from direct observation and not organized in class intervals is called raw data or ungrouped data.
Consider the example of the number of female employees in different branches of a private bank.
\(2, 4, 6, 1, 3, 5, 3, 6, 4, 4, 4, 2, 1, 3, 6, 4, 2, 5\)
Data formed by representing each observation into groups so that these groups present a more meaningful way of summarizing the data is known as grouped data. This helps us at perceiving at a glance certain salient features of data. To understand the concept of grouped data, let us take the following example. The following table represents the marks group of students studying in a school.
| Marks Group | Number of Students |
| \(30-40\) | \(3\) |
| \(40-50\) | \(5\) |
| \(50-60\) | \(6\) |
| \(60-70\) | \(2\) |
The data are summarized in groups with equal intervals. These groups are known as class intervals.
Here, the class intervals are \(30-40, 40-50, 50-60, 60-70\).
Q.2: Explain ungrouped data with an example?
Ans: The data which are obtained from direct observation is called raw data.
The marks of ten students in a monthly test are an example of raw data.
Consider the marks obtained by \(10\) students in a mathematics test as given below:
| 55 36 95 73 60 42 25 78 75 62 |
This can be considered as ungrouped data.
Q.3: How can you tell the difference between grouped and ungrouped data?
Ans: Let us discuss some differences between grouped and ungrouped data.
| Ungrouped Data | Grouped Data |
| These data can be directly observed from the given data set. | These data are formed by presenting in a group which is known as class intervals. |
| If large data are given better to avoid calculating the central tendency using ungrouped data | If large data are given better to use calculate the central tendency using ungrouped data |
| The calculation will be time-consuming using ungrouped data. | The calculation will be less time-consuming using grouped data. |
Q.4: What do you mean by the central tendency of ungrouped data?
Ans: The mean, median, and mode are the measures of central tendency. The mean or average of a number of observations is known as the sum of the values of all observations divided by the total number of observations. The median is the value of the given number of observations, which divides it into two parts accurately. The mode is the value of the observation that happens most frequently.
Q.5: What is meant by grouped and ungrouped data?
Ans: Data formed by representing each observation into groups so that these groups present a more meaningful way of summarizing the data is known as grouped data. The unorganized data obtained from direct observation are known as ungrouped data.
We hope this detailed article on the Ungrouped Data has been informative to you. If you have any queries on this article, ping us through the comment box below and we will get back to you as soon as possible.
Stay tuned to Embibe for more updates on the Ungrouped Date and other similar topics.


