39 Insightful Publications
Basic Theory Behind the Experiment
The experiment “To Plot a Cooling Curve for Molten Wax” is conducted to understand how a substance, in this case, molten wax, cools down and solidifies over time. It’s based on the principle that when a substance transitions from a liquid (molten) state to a solid state, its temperature decreases gradually. This process is governed by the laws of thermodynamics and phase transitions.
What You’ll Need
- Paraffin wax
- Gas burner
- Thermometer
- Container
- Stopwatch
Experiment Procedure
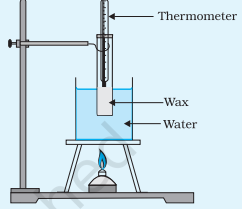
1. Prepare the Wax: Heat the wax using the arrangement given below until it becomes molten. Ensure the wax is completely liquid.

2. Initial Temperature: Use the thermometer to measure and record the initial temperature of the molten wax. This will be the starting point for your cooling curve.
3. Pour into Container: Pour the molten wax into the container or mold. Ensure that the container is clean and dry.
4. Start the stopwatch: As soon as you pour the molten wax, start the stopwatch or timer to track the time elapsed.
5. Temperature Measurements: At regular intervals (e.g., every minute), measure and record the temperature of the wax as it cools down. Make sure to use the same thermometer for consistency.
6. Record Time and Temperature: Record the time and temperature in a table. Continue measuring and recording until the wax has completely solidified and the temperature remains constant.
Observations
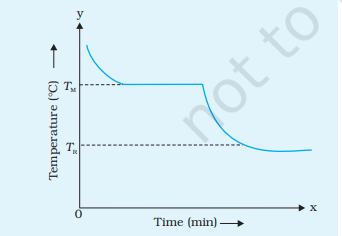
During the experiment, you will observe that the temperature of the molten wax gradually decreases over time. Initially, the temperature drops rapidly, but as time progresses, the cooling rate slows down. Eventually, the temperature stabilizes, indicating that the wax has solidified completely.
When you plot your data on a graph with time on the x-axis and temperature on the y-axis, you’ll observe a cooling curve. This curve typically starts steep, then gradually becomes less steep as the wax cools down and solidifies. The point where the curve levels off represents the melting point TM of the wax, and it indicates that the substance has transitioned from the liquid phase to the solid phase. On further cooling, the temperature of solid wax falls to room temperature TR, as shown in the figure.

This experiment helps illustrate how phase transitions occur as substances cool down, and it allows you to visualize the cooling process by plotting a cooling curve for molten wax.
FAQs on Plotting a Cooling Curve for Molten Wax
What determines the time it takes for the wax to melt?
Ans: The nature and mass of the solid wax influence the time required for melting.
Why is paraffin wax commonly used in this experiment?
Ans: Paraffin wax is used because it is a readily available substance with a well-defined melting point.
Why does the wax remain at a constant temperature during phase transitions?
Ans: The constant temperature indicates that the energy is being used for the phase transition rather than changing the temperature.
What is the temperature at which a solid becomes a liquid called?
Ans: The temperature at which this transition occurs is known as the melting point.
How does the temperature of a solid-liquid mixture change during melting?
Ans: The temperature remains constant until the entire solid has turned into a liquid.


