39 Insightful Publications
Basic Theory Behind the Experiment
The “Distance-Time Graph for a Moving Object” experiment is a fundamental physics experiment that helps us understand how an object’s position changes over time as it moves. This experiment explores the concept of motion and allows us to create a visual representation of an object’s journey.
What You’ll Need
- A Straight Path: You’ll need a clear, straight path where your object can move without obstructions or interruptions
- Measuring Tools: A measuring tape or ruler to measure distances accurately.
- Stopwatch: To record the time taken by the object to travel specific distances.
- A Moving Object: This could be a toy car, a ball, or any object that can move smoothly along the path.
Experiment Procedure
- First, set up your straight path. Ensure it is well-defined and marked for measurement. Place the starting point at one end and the endpoint at the other.
- Use your measuring tape or ruler to measure the distances along the path. Mark these distances at regular intervals, such as every meter or foot.
- Place your object at the starting point and make sure it’s stationary. This is your initial position.
- Start your stopwatch or timer as soon as you release the object. Record the time at which the object crosses each marked point along the path.
- To create the graph, plot the time on the x-axis and the corresponding distances on the y-axis. Each point on the graph represents a specific moment in time and the distance the object has travelled at that time.
Observations
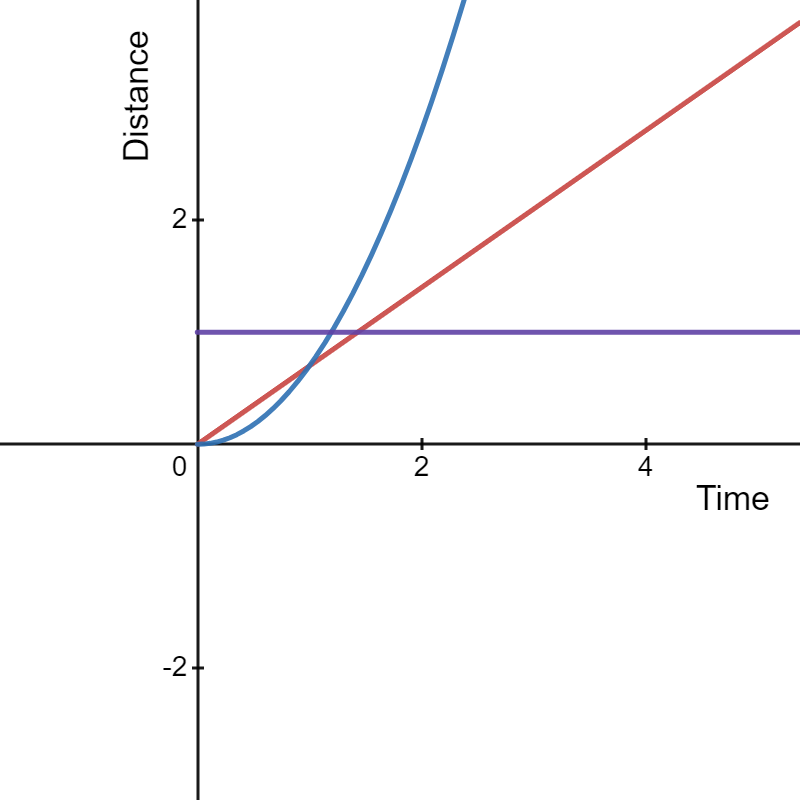
- Interpretation: Analyzing the graph allows you to understand the object’s motion. A horizontal line means the object is stationary, a sloping line shows constant speed, and a curved line suggests changing speed.

- Slope of the Graph: The slope of the line on the graph tells you the object’s speed. A steeper slope indicates a higher speed, while a shallower slope means a slower speed.
In conclusion, the “Distance-Time Graph for a Moving Object” experiment helps us visualize and understand how objects move over time. By analysing the resulting graph, we can gain insights into an object’s speed and motion characteristics.
What does the slope of a distance-time graph represent?
Ans: The slope represents the object’s speed.
Where should you place time values on the distance-time graph?
Ans: Time values go on the x-axis (horizontal axis) of the graph.
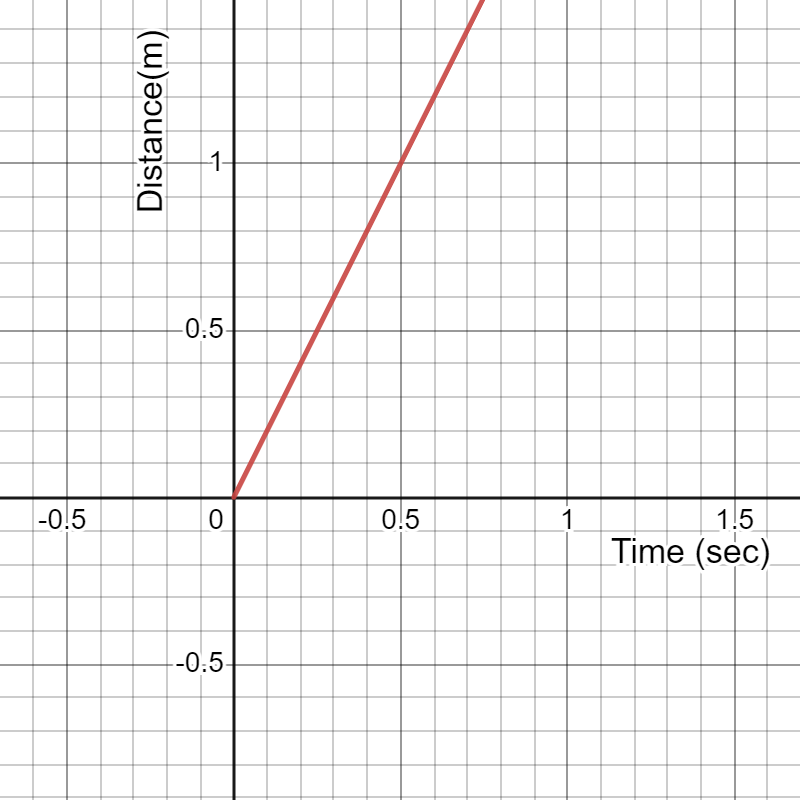
What is the speed of the object having a distance-time graph as given below?

Ans: The slope of the distance-time graph represents the object’s speed. Slope = (1-0) /(0.5-0)=2 m/sec2
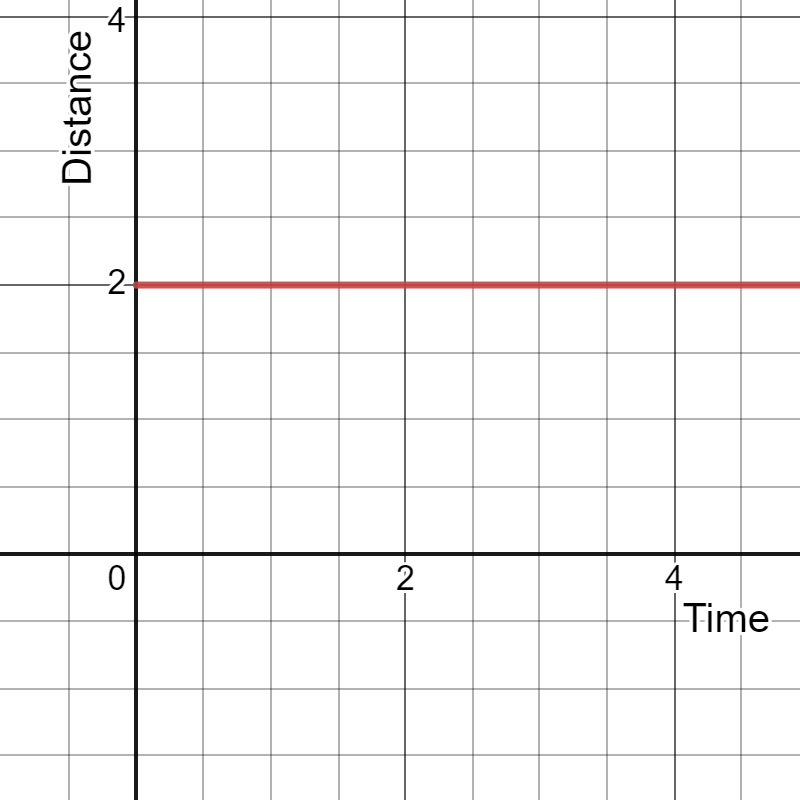
What is the speed of the object having a distance-time graph as given below?

Ans: The slope of the distance-time graph represents the object’s speed, which is zero as the line is parallel to the x-axis.
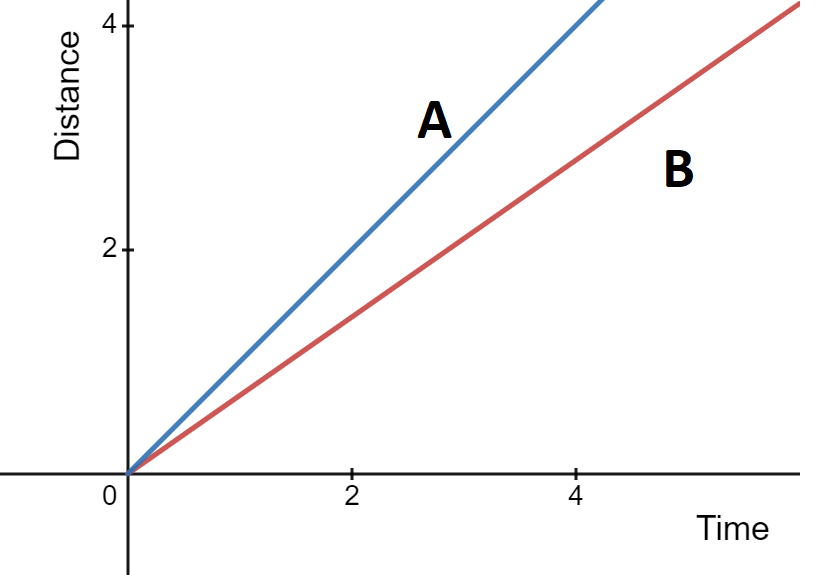
How can you differentiate between two objects with different speeds using their distance-time graphs?
Ans: The steeper the slope, the faster the object’s speed.
For example, the motion of object A is faster than object B.


