39 Insightful Publications
Basic Theory Behind the Experiment
The experiment “Plotting the v-t Graph to Determine Acceleration” is a fundamental physics experiment that helps us understand the concept of acceleration. In this experiment, we measure the velocity of an object at different points in time and then use this data to create a velocity-time (v-t) graph. This graph allows us to visualize and calculate the acceleration of the object.
- Velocity: Velocity is a measure of how fast an object is moving in a particular direction. It is a vector quantity, meaning it has both magnitude (speed) and direction. For example, a car traveling at 60 kilometers per hour (km/h) northward has a velocity of 60 km/h north.
- Acceleration: Acceleration, on the other hand, measures the rate of change of velocity. In simpler terms, it tells us how quickly an object’s velocity is changing. If an object is speeding up, slowing down, or changing direction, it is experiencing acceleration.
What You’ll Need
- A moving object
- A stopwatch
- A measuring tape or ruler
- Graph paper
- Pen or pencil
Procedure
- Choose a flat surface for your experiment.
- Mark a starting point and set up the measuring tape.
- Release the object from the starting point and start the stopwatch.
- Measure and record the object’s distance from the starting point at regular time intervals (e.g., every second).
- Plot the recorded data on the graph paper with time on the x-axis and velocity on the y-axis.
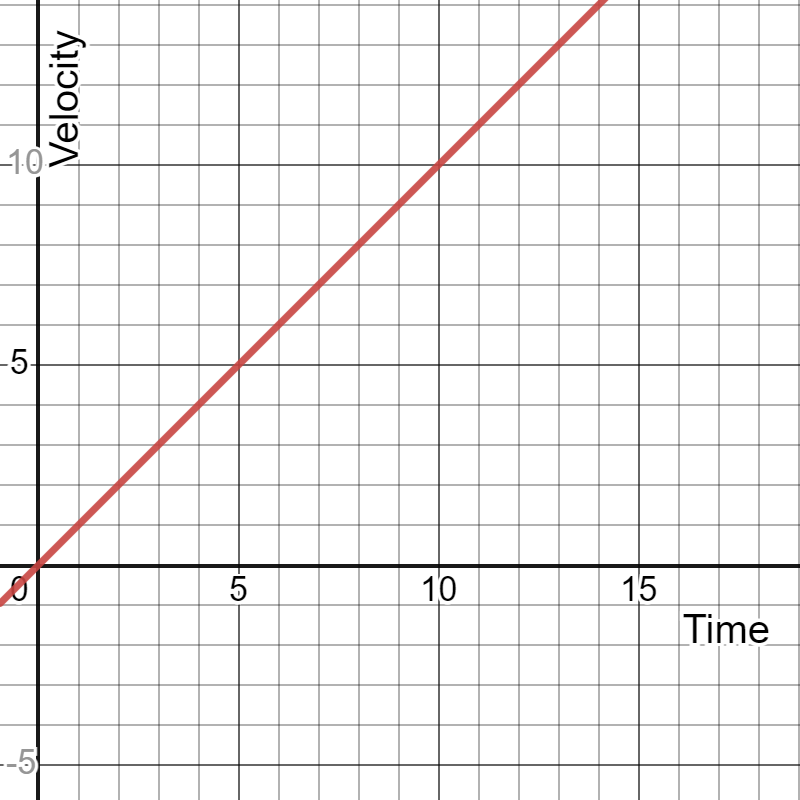
- Draw a line connecting the points, and the slope of this line will give you the acceleration.
Observations
You will observe that as time increases, the velocity of the object changes. The steeper the line on the graph, the greater the acceleration.

FAQs on Plot the V-T Graph to Determine The Acceleration
Why do we use a Velocity-time (V-t) graph to determine acceleration?
Answer: A V-t graph allows us to visualize and quantify how an object’s velocity changes over time, making it easier to calculate acceleration.
How can you calculate acceleration using a V-t graph?
Answer: Acceleration can be found by calculating the slope of the v-t graph (Δv/Δt).
How does a positive slope on the V-t graph indicate acceleration?
Answer: A positive slope means the object is speeding up, indicating positive acceleration.
How would you describe the motion of an object with a horizontal line on the V-t graph?
Answer: The object is moving at a constant velocity, so there is no acceleration.
How can you distinguish between positive and negative acceleration on a V-t graph?
Answer: A positive slope represents positive acceleration, while a negative slope represents negative acceleration (deceleration).


