Mary Jones and Geoff Jones Solutions for Chapter: Enzymes, Exercise 3: End-of-chapter questions
Mary Jones Biology Solutions for Exercise - Mary Jones and Geoff Jones Solutions for Chapter: Enzymes, Exercise 3: End-of-chapter questions
Attempt the practice questions on Chapter 5: Enzymes, Exercise 3: End-of-chapter questions with hints and solutions to strengthen your understanding. Cambridge IGCSE® Biology Coursebook Third Edition solutions are prepared by Experienced Embibe Experts.
Questions from Mary Jones and Geoff Jones Solutions for Chapter: Enzymes, Exercise 3: End-of-chapter questions with Hints & Solutions
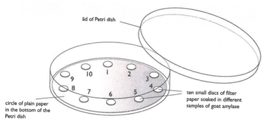
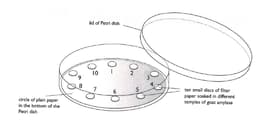
Students investigated a sample of amylase from Goats. Small filter paper discs were each soaked in a different sample of goat amylase. The students tested the activity of these amylase samples using plain paper. The plain paper contains starch. A circle of plain paper was placed into a petri dish as shown in the diagram below. Iodine solution was used to stain the starch on plain paper.
Ten amylase-soaked filter paper discs were placed into one of the Petri-dishes as shown in the diagram. The students lifted the filter paper discs at one-minute intervals and recorded the number of areas where there had been a reaction. How would the students know that a reaction had taken place?
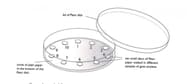
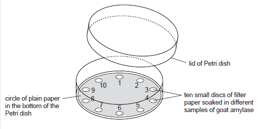
Students investigated a sample of amylase from Goats. Small filter paper discs were each soaked in a different sample of goat amylase. The students tested the activity of these amylase samples using plain paper. The plain paper contains starch. A circle of plain paper was placed into a petri dish as shown in the diagram below. Iodine solution was used to stain the starch on plain paper.
Ten amylase-soaked filter paper discs were placed into one of the Petri-dishes as shown in the diagram. The students lifted the filter paper discs at one-minute intervals and recorded the number of areas where there had been a reaction.
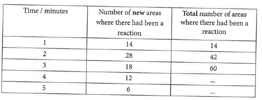
If a reaction had not taken place, the students replaced the disc of filter paper for another minute. This procedure was repeated for five minutes. Their results are recorded in the table below.
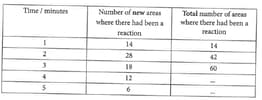
Copy and complete the table by calculating the total number of areas where there had been a reaction after 4 and 5 minutes.
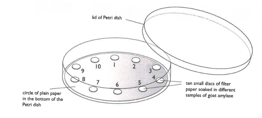
Students investigated a sample of amylase from Goats. Small filter paper discs were each soaked in a different sample of goat amylase. The students tested the activity of these amylase samples using plain paper. The plain paper contains starch. A circle of plain paper was placed into a petri dish as shown in the diagram below. Iodine solution was used to stain the starch on plain paper.
Ten amylase-soaked filter paper discs were placed into one of the Petri-dishes as shown in the diagram. The students lifted the filter paper discs at one-minute intervals and recorded the number of areas where there had been a reaction.
If a reaction had not taken place, the students replaced the disc of filter paper for another minute. This procedure was repeated for five minutes. Their results are recorded in the table below.

Plot a graph using the data from the first two columns, to show the differences in the activity of amylase.
Students investigated a sample of amylase from Goats. Small filter paper discs were soaked in a different sample of goat amylase. The students tested the activity of these amylase samples using plain paper. The plain paper contains starch. A circle of plain paper was placed into a petri dish as shown in the diagram below. Iodine solution was used to stain the starch on plain paper.
Ten amylase-soaked filter paper discs were placed into one of the Petri-dishes as shown in the diagram. The students lifted the filter paper discs at one-minute intervals and recorded the number of areas where there had been a reaction.
If a reaction had not taken place, the students replaced the disc of filter paper for another minute. This procedure was repeated for five minutes. Their results are recorded in the table below.

Suggest two reasons for the differences in amylase activity of the samples.
Students investigated a sample of amylase from Goats. Small filter paper discs were each soaked in a different sample of goat amylase. The students tested the activity of these amylase samples using plain paper. The plain paper contains starch. A circle of plain paper was placed into a petri dish as shown in the diagram below. Iodine solution was used to stain the starch on plain paper.
Ten amylase-soaked filter paper discs were placed into one of the Petri-dishes as shown in the diagram. The students lifted the filter paper discs at one-minute intervals and recorded the number of areas where there had been a reaction.
If a reaction had not taken place, the students replaced the disc of filter paper for another minute. This procedure was repeated for five minutes. Their results are recorded in the table below.
Suggest three ways in which you could improve this investigation.
Enzymes are biological catalysts. The diagram below shows how the enzyme, sucrase break down a molecule of sucrose.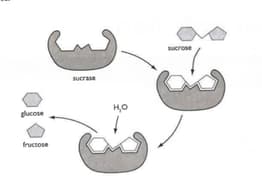
Describe how sucrase catalyse the break-down of sucrose?
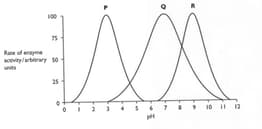
Three enzymes P, Q, R were extracted from a different region of the alimentary canal of a mammal. The effect Of On the activity of the enzymes was investigated at C. The results are shown in the diagram below.

Explain Why the investigation was carried out at C.?
Three enzymes P, Q, R were extracted from a different region of the alimentary canal of a mammal. The effect of On the activity of the enzymes was investigated at C. The results are shown in the diagram below. Using the information in the diagram, describes the effect of increasing On the rate of activity of enzyme Q?