
Dean Chalmers and Julian Gilbey Solutions for Chapter: Representation of Data, Exercise 6: EXERCISE 1C
Dean Chalmers Mathematics Solutions for Exercise - Dean Chalmers and Julian Gilbey Solutions for Chapter: Representation of Data, Exercise 6: EXERCISE 1C
Attempt the free practice questions on Chapter 1: Representation of Data, Exercise 6: EXERCISE 1C with hints and solutions to strengthen your understanding. Cambridge International AS & A Level Mathematics : Probability & Statistics 1 Course Book solutions are prepared by Experienced Embibe Experts.
Questions from Dean Chalmers and Julian Gilbey Solutions for Chapter: Representation of Data, Exercise 6: EXERCISE 1C with Hints & Solutions
The diameters, , of cylindrical electronic components are represented in the following cumulative frequency graph.
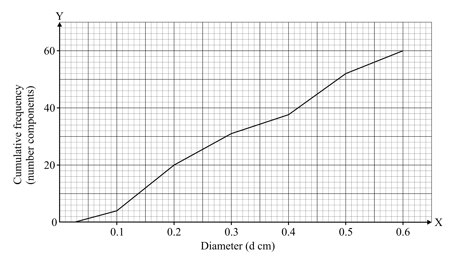
Diameter
Estimate the number of components that have:
a diameter of less than
The diameters, , of cylindrical electronic components are represented in the following cumulative frequency graph.
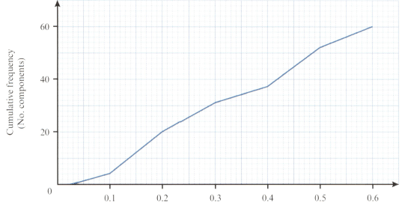
Diameter
Estimate the number of components that have:
a radius of or more.
The daily journey times for bank staff to get to work are given in the following table.
| Time | |||||||
| No. staff |
How many staff take between and minutes to get to work?
The daily journey times for bank staff to get to work are given in the following table.
| Time | |||||||
| No. staff |
Find the exact number of staff who take minutes or more to get to work, given that of the staff take less than minutes and that of the staff take minutes or more.
The distances, in , that new cars can travel on litre of fuel are shown in the table.
| Distance | |||||
| No. cars |
These distances are greater than the distances the cars will be able to travel after they have covered more than .
Estimate how many of the cars can travel or more on litre of fuel when new, but not after they have covered more than .
A small company produces cylindrical wooden pegs for making garden chairs. The lengths and diameters of the pegs produced yesterday have been measured independently by two employees, and their results are given in the following table.
| Length | |||||||
| No. pegs |
| Diameter | |||||
| No. pegs |
On the same axes, draw two cumulative frequency graphs: one for lengths and one for diameters.
Correct to the nearest millimetre, the lengths and diameters of of these pegs are equal. Find the least and greatest possible value of .
A peg is acceptable for use when it satisfies both and . Explain why you cannot obtain from your graphs an accurate estimate of the number of these pegs that are acceptable. Suggest what the company could do differently so that an accurate estimate of the proportion of acceptable pegs could be obtained.


