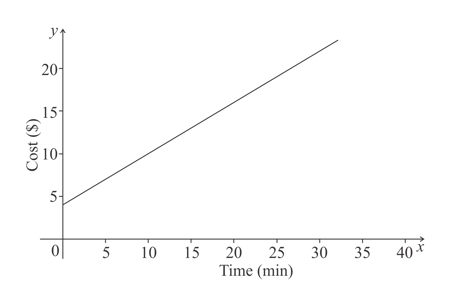
Lynn Byrd, Greg Byrd and, Chris Pearce Solutions for Chapter: Graphs, Exercise 5: Exercise 11.4
Lynn Byrd Mathematics Solutions for Exercise - Lynn Byrd, Greg Byrd and, Chris Pearce Solutions for Chapter: Graphs, Exercise 5: Exercise 11.4
Attempt the practice questions on Chapter 11: Graphs, Exercise 5: Exercise 11.4 with hints and solutions to strengthen your understanding. Cambridge Lower Secondary Mathematics Learner's Book 7 Second Edition Digital Access solutions are prepared by Experienced Embibe Experts.
Questions from Lynn Byrd, Greg Byrd and, Chris Pearce Solutions for Chapter: Graphs, Exercise 5: Exercise 11.4 with Hints & Solutions
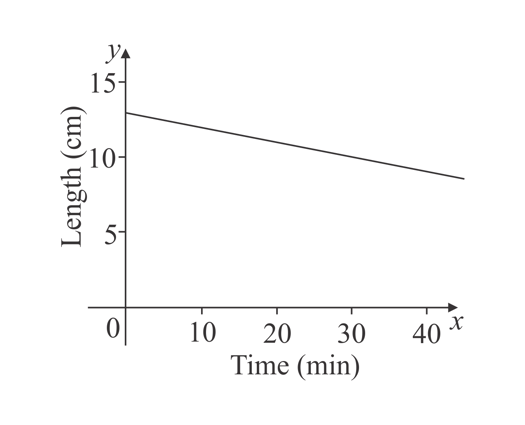
This graph shows the length of a burning candle. How much does the length of the candle decrease every minute.
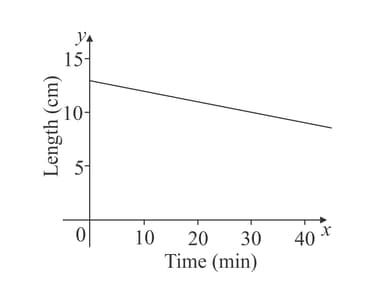
This graph shows the length of a burning candle. If candle burns at same rate, how long will it take to burn completely?
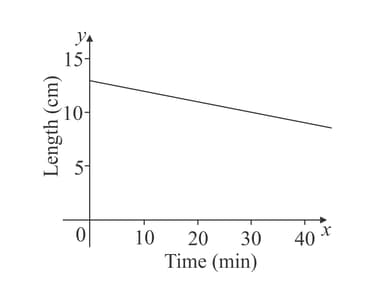
This graph shows the length of a burning candle. Is the gradient positive, negative or zero?
A taxi has an initial charge and then a charge for each minute of journey. This graph shows the total cost. How does the graph show that the initial charge is .
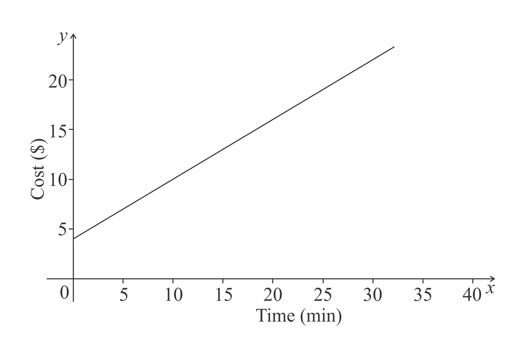
A taxi has an initial charge and then a charge for each minute of journey. This graph shows the total cost. Copy and complete this table.
| Time | ||||
| Cost |
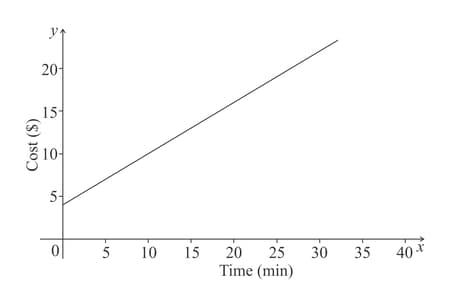
A taxi has an initial charge and then a charge for each minute of journey. This graph shows the total cost. Work out the extra cost of each minute of the taxi journey.
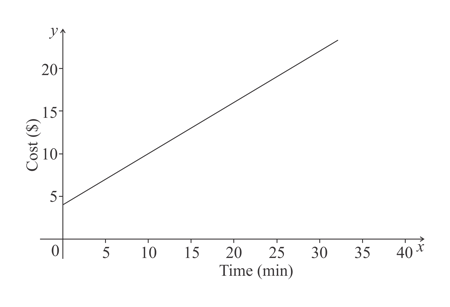
A taxi has an initial charge and then a charge for each minute of journey. This graph shows the total cost.
Sofia says: The cost of a hour journey is twice the cost of 30 minutes journey. Show that Sofia is not correct.
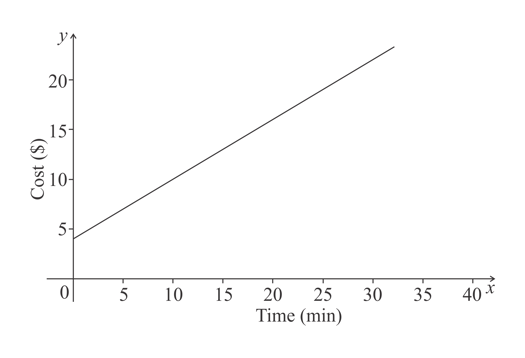
A taxi has an initial charge and then a charge for each minute of journey. This graph shows the total cost. Is the gradient positive, negative or zero?
