
David Sang and Graham Jones Solutions for Chapter: Kinematics: Describing Motion, Exercise 8: Questions
David Sang Physics Solutions for Exercise - David Sang and Graham Jones Solutions for Chapter: Kinematics: Describing Motion, Exercise 8: Questions
Attempt the practice questions on Chapter 1: Kinematics: Describing Motion, Exercise 8: Questions with hints and solutions to strengthen your understanding. Physics for Cambridge International AS & A Level Coursebook 3rd Edition Digital Access solutions are prepared by Experienced Embibe Experts.
Questions from David Sang and Graham Jones Solutions for Chapter: Kinematics: Describing Motion, Exercise 8: Questions with Hints & Solutions
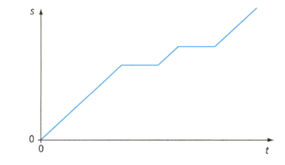
The displacement-time sketch graph in th figure represent the journey of a bus. What does the graph tell you about the journey?
Sketch a displacement - time graph to show your motion for the following event. You are walking at aconstant speed across a field after jumping off a gate, Suddenly you see a horse and stop. Your friend says there's no danger, so you walk on at a reduced constant speed. The horse neigh, and you run back to the gate. Explain how each section of the walk relates to a section of your graph.
The Table shows the displacement of a racing car at different times as it travels along a straight track during a speed trial. Determine the car’s velocity.
| Displacement | |||||
| Time |
The Table shows the displacement of a racing car at different times as it travels along a straight track during a speed trial.
| Displacement | |||||
| Time |
Draw the displacement-time graph and use it to find the car's velocity.
An old car travels due south. The distance it travels at hourly intervals is shown in the table
Draw the distance-time graph to represent the car journey.
| Time | |||||
| Distance |
An old car travels due south.The distance it travels at hourly intervals is shown in the table
| Time / h | 0 | 1 | 2 | 3 | 4 |
| Distance / km | 0 | 23 | 46 | 69 | 84 |
From the distance-time graph deduce the car's speed in during the first three hours of the journey
An old car travels due south. The distance it travels at hourly intervals is shown in the table
| Time / h | 0 | 1 | 2 | 3 | 4 |
| Distance / km | 0 | 23 | 46 | 69 | 84 |
What is the car's average speed in during the whole journey,


