West Bengal Board Solutions for Chapter: Graphs, Exercise 7: Let's work out - 18
West Bengal Board Mathematics Solutions for Exercise - West Bengal Board Solutions for Chapter: Graphs, Exercise 7: Let's work out - 18
Attempt the practice questions on Chapter 18: Graphs, Exercise 7: Let's work out - 18 with hints and solutions to strengthen your understanding. Ganitprabha (MATHEMATICS TEXT BOOK) Class 8 solutions are prepared by Experienced Embibe Experts.
Questions from West Bengal Board Solutions for Chapter: Graphs, Exercise 7: Let's work out - 18 with Hints & Solutions
Put three more points on the graph other than collinear points and .
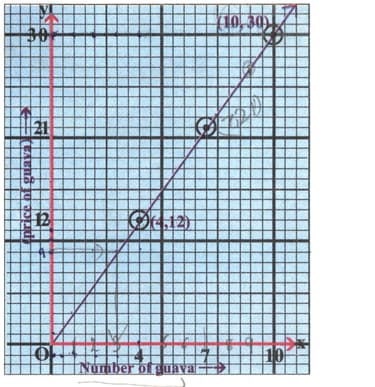
Study the given graph and answer the given questions below.
guava = lengths of sides of the smallest squares along X-axis.
rupee = length of a side of a one smallest square along y-axis.
i) Write the relation between the number of guava and price of guava from the graph.
ii) The price of guavas is then find .
iii) Write the number of guavas in .
iv) Write the number of guavas in .
v) If the price of guavas is then find .

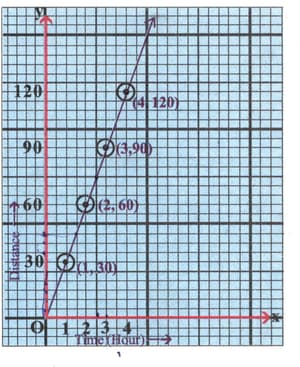
Study the given graph and answer the given questions below.
hourLengths of sides of the smallest squares along X-axis.
Length of a side of a one smallest square along y-axis.
i) Find the relation between time and distance.
ii) Find the distance travelled in .
iii) If the time required to travel is then find .
iv) Find the velocity .
v) If the distance travelled in is , then find .
vi) If the time required to travel is then find .

Draw the graph of the following data on the graph paper. See whether it is linear graph.
| Number of pencils | 3 | 5 | 7 | 8 |
| Price(Rs) | 6 | 10 | 14 | 16 |
Draw the graph of the following data on the graph paper. See whether it is linear graph.
| Time (in Hours) | 2 | 4 | 6 | 8 |
| distance (in kms) | 40 | 80 | 120 | 160 |
Draw the graph of the following data on the graph paper. See whether it is linear.
| Number of bags | 1 | 2 | 3 | 4 |
| Price | 50 | 100 | 150 | 200 |
Draw the graph of the following data on the graph paper. See whether it is linear.
| Number of books | 2 | 3 | 5 | 8 |
| Price | 50 | 75 | 125 | 200 |
Draw the graph of the following data on the graph paper. See whether it is linear.
| Number of overs | 1 | 3 | 5 | 7 |
| Scores at the end of overs | 4 | 12 | 20 | 28 |
