Exercise 24(C)
S K Gupta Mathematics Solutions for Exercise 24(C)
Simple step-by-step solutions to Exercise 24(C) questions of Graphical Representation of Data from ICSE NUMBERS WIZ. Also get 3D topic explainers, cheat sheets, and unlimited doubts solving on EMBIBE.
Questions from Exercise 24(C) with Hints & Solutions
Draw the pie chart to represent the following information, first working out the angles.
The number of books lent out by a school library each day
| Days | Mon | Tues | Wed | Thurs | Fri |
|---|---|---|---|---|---|
| No of books lent |
The marks obtained by a student in different subjects are shown. Draw a pie diagram showing the information.
| Subject | English | Marathi | Science | Mathematics | Social science | Hindi |
| Marks |
The number of students in a hostel speaking different languages is given below. Represent the data in a pie chart.
| Languages | Hindi | English | Marathi | Tamil | Bengali | Total |
|---|---|---|---|---|---|---|
| Number of students |
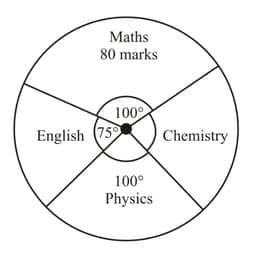
A pie diagram of the marks secured by a student in Maths, English, Physics and Chemistry is shown here. Read the graph and find the marks in Chemistry secured by the student.

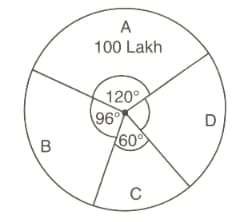
A pie chart representing the population of four cities is shown here. Read the pie chart and find the population of the city D in lakhs

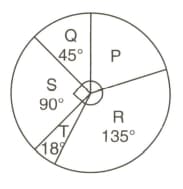
The pie chart shows the number of participants of countries and taking part in a tennis tournament. Calculate the percentage of participants

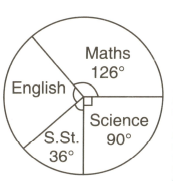
A school has a strength of students. The pie graph alongside shows the interests of students in different subjects. The number of students interested in English is

