
Mahabir Singh Solutions for Chapter: Data Handling, Exercise 3: ACHIEVERS SECTION (HOTS
Mahabir Singh Mathematics Solutions for Exercise - Mahabir Singh Solutions for Chapter: Data Handling, Exercise 3: ACHIEVERS SECTION (HOTS
Attempt the practice questions on Chapter 5: Data Handling, Exercise 3: ACHIEVERS SECTION (HOTS with hints and solutions to strengthen your understanding. IMO Olympiad Work Book 8 solutions are prepared by Experienced Embibe Experts.
Questions from Mahabir Singh Solutions for Chapter: Data Handling, Exercise 3: ACHIEVERS SECTION (HOTS with Hints & Solutions
A glass jar contains red, green, blue ad yellow marbles of same size. Hari takes out a marble from the jar at random. What is the probability that the chosen marble is of red colour?
The given pie chart shows the spending of a family on various heads during a month. Study the graph and answer the question.
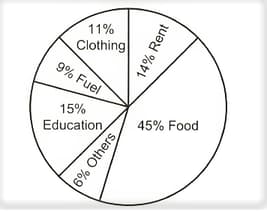
If the total income of the family is , then the amount spent on rent and food together is __________.
The given bar graph shows the number of students in a hostel speaking different languages. Study the bar graph and answer the following questions.
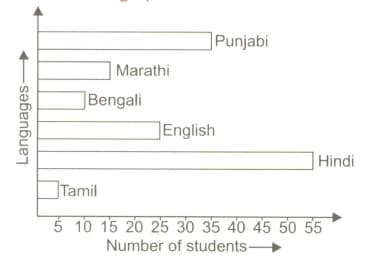
i. How many students are there in the hostel?
ii. What is the ratio of the number of students speaking Punjabi to those speaking English?
iii. What is the percentage of the students speaking Marathi over those speaking Hindi?
Look at the given below data.
The frequency distribution of the data is given here.
| Group | Tally marks | Frequency |
| Group | Tally marks | Frequency |
Which of the above tables is the frequency table of the given data?


