
Mahabir Singh Solutions for Chapter: Introduction to Graphs, Exercise 2: ACHIEVERS SECTION (HOTS)
Mahabir Singh Mathematics Solutions for Exercise - Mahabir Singh Solutions for Chapter: Introduction to Graphs, Exercise 2: ACHIEVERS SECTION (HOTS)
Attempt the practice questions on Chapter 15: Introduction to Graphs, Exercise 2: ACHIEVERS SECTION (HOTS) with hints and solutions to strengthen your understanding. IMO Olympiad Work Book 8 solutions are prepared by Experienced Embibe Experts.
Questions from Mahabir Singh Solutions for Chapter: Introduction to Graphs, Exercise 2: ACHIEVERS SECTION (HOTS) with Hints & Solutions
The graph shows the temperature forecast and the actual temperature of a city on ten days.
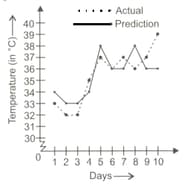
On what day, the graph shows the maximum deviation of actual temperature from the forecast?
The graph shows the production of cycles (in thousands) of two factories and for ten years.
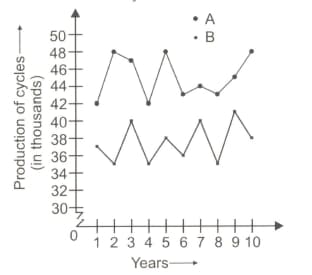
Find the production of cycles of in the year when combined production of cycles was maximum.
The following graph shows the number of pages read by Ashok in a week.
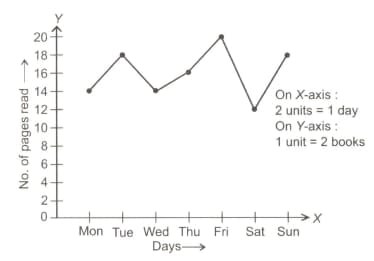
Find the ratio of number of pages read on Tuesday and Wednesday together to the total number of pages read.
The following graph shows the amount of milk (in ) that a milkman sold over days.
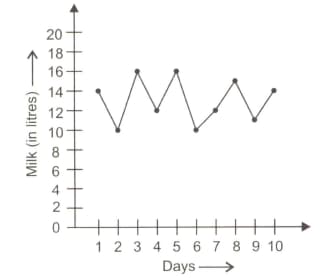
On an average, how much milk he sells every day?
Study the graph and answer the questions that follow.
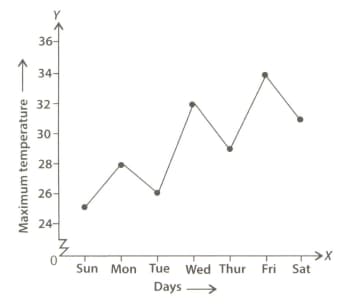
(a) On which day was the temperature ?
(b) On which day was the temperature the least?
(c) Which was the hottest day?


