L.A.Sena Solutions for Chapter: Direct Current, Exercise 1: Exercise
L.A.Sena Physics Solutions for Exercise - L.A.Sena Solutions for Chapter: Direct Current, Exercise 1: Exercise
Attempt the practice questions on Chapter 4: Direct Current, Exercise 1: Exercise with hints and solutions to strengthen your understanding. A Collection of Questions and problems in Physics solutions are prepared by Experienced Embibe Experts.
Questions from L.A.Sena Solutions for Chapter: Direct Current, Exercise 1: Exercise with Hints & Solutions
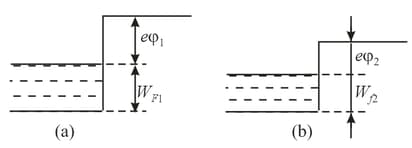
The behavior of the potential energy of an electron inside and outside a metal is shown for two metals in Figures. The same figures indicate the limiting kinetic energies of electrons in the metals (the Fermi levels) at . If the metals are brought into contact, what will be the values of the internal and external contact potential differences? In which metal will the electron concentration be higher?
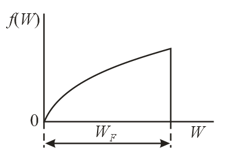
The energy distribution function for electrons in a metal at absolute zero can be written as follows:
.....
where is a constant coefficient that is a combination of universal constants. This function terminates at , which is the limiting energy, or the Fermi level. Using , establish how the limiting energy depends on electron concentration.
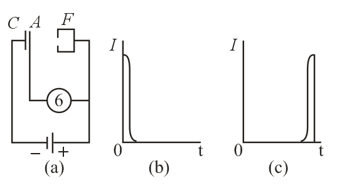
The dependence of the logarithm of conductivity, In , on , where is the temperature, for two semiconductors is shown in the figure. In which of the two semiconductors is the gap (the forbidden band) between the valence band and the conduction band wider?
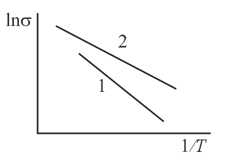
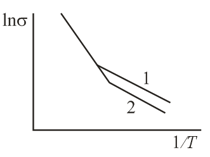
The dependence of the logarithm of conductivity, In , on for two semiconductors is shown schematically in the figure. In which respect do these semiconductors differ?
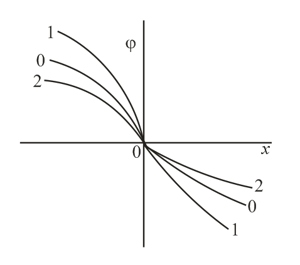
The distribution of potential near the boundary between two semiconductors with different types of conduction depends on the direction of the applied external voltage. Which distribution corresponds to the blocking direction and which, to conduction? To what semiconductors do the left and right branches of the curves in the figure belong?
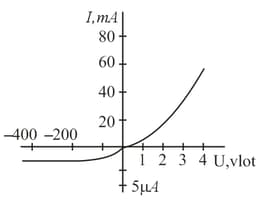
The current-voltage characteristic of a semiconductor diode based on the properties of the junction has two branches: the upper right branch and the lower left branch. Since the right branch corresponds to small voltages and the left branch to considerably higher voltages (with the currents in the conductive direction being much higher than the currents in the blocking direction;, the two branches are constructed using different scales. What is the explanation for the existence of the left branch and in what manner does the current in the blocking direction depend on the temperature of the diode?
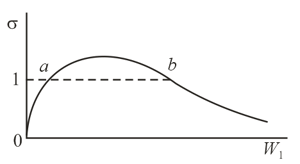
The phenomenon of secondary electron emission consists in the following. When electrons bombard a solid surface, the surface emits secondary electrons (and partially reflects the primary electrons, which impinge on the surface). Secondary electron emission is characterized by the secondary emission coefficient , which is the ratio of the secondary electron current to the primary current. The dependence of the secondary emission coefficient on the primary electron energy for a certain dielectric is depicted in the figure. At the surface of the dielectric does not change its potential under electron bombardment, since the number of electrons leaving the surface every second is equal in this case to the number of electrons bombarding the surface every second. The two points and on the vs. curve correspond to . At which point is the process stable and at which is it unstable?
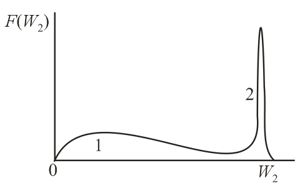
Under secondary electron emission, the energy distribution function for secondary electrons is represented sufficiently well by two curves ( and ) show in the figure accompanying the problem. Which of the two curves represents the primary electrons and which, the "true" secondary electrons?
