EXERCISE
Jharkhand Board Mathematics Solutions for EXERCISE
Simple step-by-step solutions to EXERCISE questions of Introduction to Graphs from Mathematics : Class VIII. Also get 3D topic explainers, cheat sheets, and unlimited doubts solving on EMBIBE.
Questions from EXERCISE with Hints & Solutions
The following graph shows the temperature of a patient in a hospital, recorded every hour.
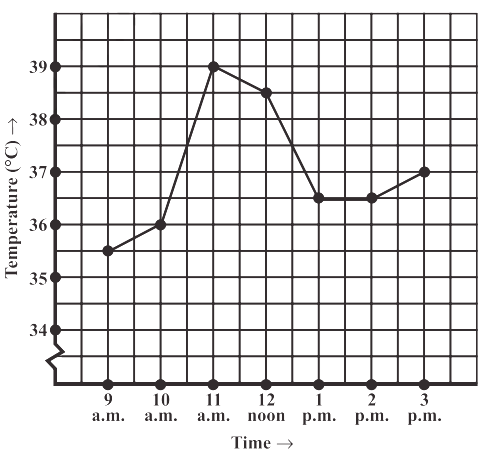
The patient’s temperature was the same two times during the period given. What were these two times?
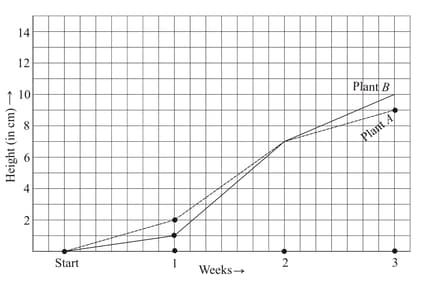
For an experiment in Botany, two different plants, plant and plant were grown under similar laboratory conditions. Their heights were measured at the end of each week for weeks. The results are shown by the following graph.
How high was Plant after (i) weeks (ii) weeks?
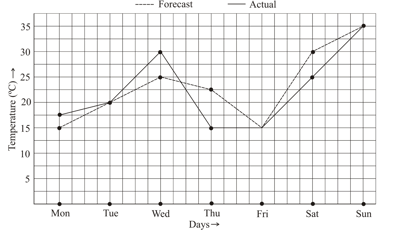
The following graph shows the temperature forecast and the actual temperature for each day of a week.
On which days was the forecast temperature the same as the actual temperature.
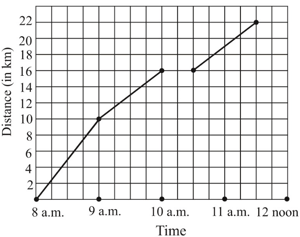
A courier-person cycles from a town to a neighbouring suburban area to deliver a parcel to a merchant. His distance from the town at different times is shown by the following graph.
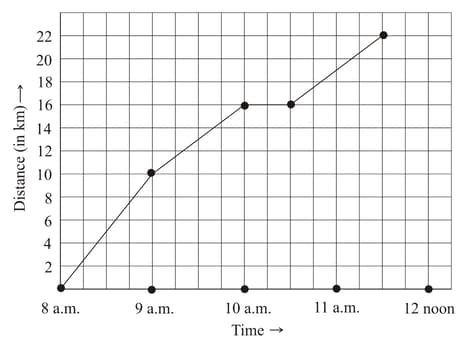
If the distance of the place of merchant from the town is , write as the final answer.
A courier-person cycles from a town to a neighbouring suburban area to deliver a parcel to a merchant. His distance from the town at different times is shown by the following graph. If he rides fastest during to find ?
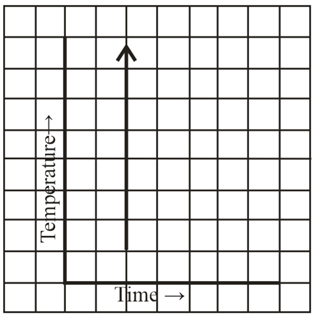
Can there be a time-temperature graph as follows? Justify your answer.
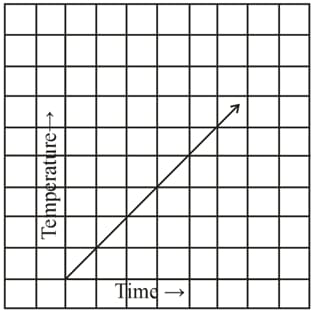
Can there be a time-temperature graph as follows? Justify your answer.
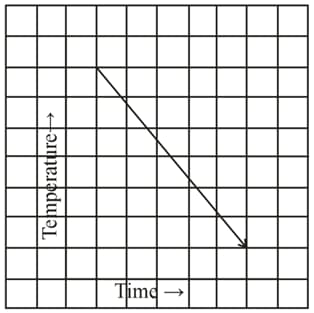
Can there be a time-temperature graph as follows? Justify your answer.