
STEP UP
Malini Sheshdari Science Solutions for Exercise - STEP UP
Simple step-by-step solutions to STEP UP questions of Motion and Time from CONCERT Science 7. Also get 3D topic explainers, cheat sheets, and unlimited doubts solving on EMBIBE.
Questions from STEP UP with Hints & Solutions
Why does a simple pendulum in motion stop swinging after some time even if you do not stop it yourself?
How did the sundial help our ancestors determine the time of the day?
The winning athlete may reach the finish line sometime in less than a tenth of a second before the athlete in second place. How is this short time interval measured?
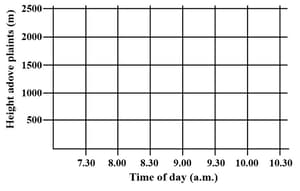
A bus descends through a height of while travelling downhill from a hill station to the plains. The bus set out at . and completed its journey at . Assume that the speed of the bus remains constant during the journey. Draw a line graph showing the vertical descent of the bus over time. Mark its progress every half an hour.
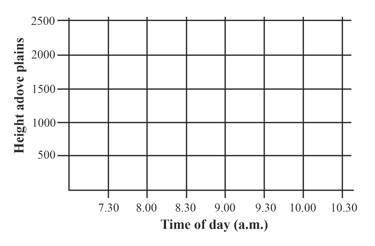
A bus descends through a height of while travelling downhill from a hill station to the plains. The bus set out at . and completed its journey at . Assume that the speed of the bus remains constant during the journey.
What is the rate of vertical descent of the bus in ? Also express it in .
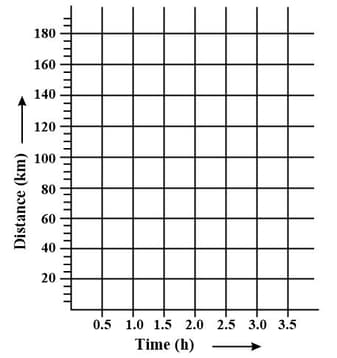
A truck and a car set off from a point at the same time and both travel with constant speeds. The truck travels at and the car travels at .
Using lines of different colours, draw distance-time graphs to represent the motion of both the truck and the car over the first three hours.

A truck and a car set off from a point at the same time and both travel with constant speeds. The truck travels at and the car travels at .
Draw a dotted line on the graph to mark the locations of the truck and car at a point into the journey. How far is each vehicle from the starting point?
Draw a pie chart to represent how you spend your waking hours in a day. Use the data given in the table.
| Activity | Time spent |
| Studying | 5 h |
| Playing with friends | 1 h |
| Playing sports | 3 h |
| Watching television | 2 h |
| Reading | 2 h |
| Eating meals | 2 h |
| Bathing and getting ready for school | 1 h |
| Total | 16 h |


