
Mary Jones and Geoff Jones Solutions for Chapter: Transport in Plants, Exercise 3: End-of-chapter questions
Mary Jones Biology Solutions for Exercise - Mary Jones and Geoff Jones Solutions for Chapter: Transport in Plants, Exercise 3: End-of-chapter questions
Attempt the practice questions on Chapter 8: Transport in Plants, Exercise 3: End-of-chapter questions with hints and solutions to strengthen your understanding. Cambridge IGCSE® Biology Coursebook Third Edition solutions are prepared by Experienced Embibe Experts.
Questions from Mary Jones and Geoff Jones Solutions for Chapter: Transport in Plants, Exercise 3: End-of-chapter questions with Hints & Solutions
The diagrams show a transverse section of a stem, and a transverse section of a root.

(a) Explain what is meant by the term transverse section?
The diagrams show a transverse section of a stem, and a transverse section of a root.
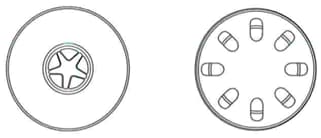
(b) Make a copy of the diagram that shows a transverse section of a stem. Label the xylem tissue
The diagrams show a transverse section of a stem, and a transverse section of a root.
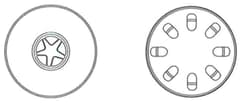
(c) Make a copy of the diagram that shows a transverse section of a root. Label the xylem tissue
The diagrams show a transverse section of a stem, and a transverse section of a root.

(d) On your two diagrams, label the position of phloem tissue.
(a) Using the term water potential, explain how water is absorbed into root hairs from the soil.
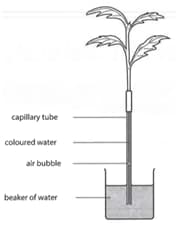
A potometer is a piece of apparatus that is used to measure water uptake by plants.
Most of the water taken up by plants replaces water lost in transpiration.
A student used a potometer to investigate the effect of wind speed on the rate of water uptake by a leafy shoot. As the root absorbs water the air bubble moves upwards.
The student's apparatus is shown in the diagram below.
The student used a fan with five different settings and measured the wind speed. The results are shown in the table below.
| Wind speed / metres per second | Distance travelled by the air bubble / mm | Time / minutes | Rate of water uptake / mm per minute |
| 0 | 4 | 10 | 0.4 |
| 2 | 12 | 5 | 2.4 |
| 4 | 20 | 5 | 4.0 |
| 6 | 35 | 5 | 7.0 |
| 8 | 40 | 2 |
(b) Calculate the rate of water uptake at the highest wind speed and write your answer in the table.
The student used a fan with five different settings and measured the wind speed. The results are shown in the table below.
| Wind speed / metres per second | Distance travelled by the air bubble / mm | Time / minutes | Rate of water uptake / mm per minute |
| 0 | 4 | 10 | 0.4 |
| 2 | 12 | 5 | 2.4 |
| 4 | 20 | 5 | 4.0 |
| 6 | 35 | 5 | 7.0 |
| 8 | 40 | 2 |
(c) Describe the effect of increasing wind speed on the rate of water uptake. You may use figures from the table to support your answer.
The student used a fan with five different settings and measured the wind speed. The results are shown in the table below.
| Wind speed / metres per second | Distance travelled by the air bubble / mm | Time / minutes | Rate of water uptake / mm per minute |
| 0 | 4 | 10 | 0.4 |
| 2 | 12 | 5 | 2.4 |
| 4 | 20 | 5 | 4.0 |
| 6 | 35 | 5 | 7.0 |
| 8 | 40 | 2 |
(d) State two environmental factors other than wind speed, that the student should keep constant during the investigation.


