
Mary Jones, Richard Fosbery, Dennis Taylor and, Jennifer Gregory Solutions for Chapter: Enzymes, Exercise 11: EXAM-STYLE QUESTIONS
Mary Jones Biology Solutions for Exercise - Mary Jones, Richard Fosbery, Dennis Taylor and, Jennifer Gregory Solutions for Chapter: Enzymes, Exercise 11: EXAM-STYLE QUESTIONS
Attempt the practice questions on Chapter 3: Enzymes, Exercise 11: EXAM-STYLE QUESTIONS with hints and solutions to strengthen your understanding. Biology for Cambridge International AS & A Level coursebook 2nd Edition Digital Access solutions are prepared by Experienced Embibe Experts.
Questions from Mary Jones, Richard Fosbery, Dennis Taylor and, Jennifer Gregory Solutions for Chapter: Enzymes, Exercise 11: EXAM-STYLE QUESTIONS with Hints & Solutions
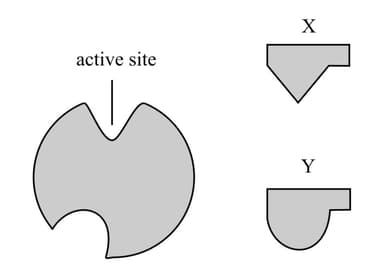
The diagram shows an enzyme and two inhibitors of the enzyme, X and Y. Which of the following describes the two inhibitors?
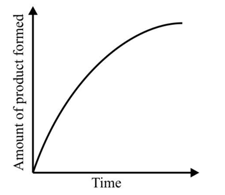
In a reaction controlled by an enzyme, which of the following graphs shows the effect of substrate concentration on the rate of the reaction, assuming the reaction is allowed to go to completion?
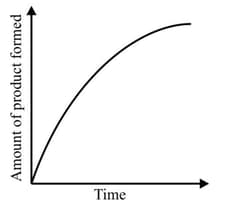
The graph shows the progress of the digestion of starch by the enzyme salivary amylase. Why does the reaction slow down?
An enzyme with a high affinity for its substrate has a:
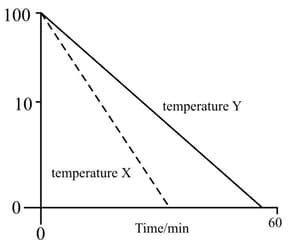
If methylene blue dye is added to a suspension of yeast cells, any living cells remain colourless. However, any dead cells are stained blue. This fact was used to carry out an investigation into the rate at which yeast cells were killed at two different temperatures (at high temperatures the yeast enzymes will be denatured). The results are shown in the diagram.
Copy the graph in Question 3 and draw a line from which the initial rate of reaction could be calculated.
The graph shows the effect of changes in pH on the activity of the enzyme lysozyme.

Describe the effect of pH on this enzyme.
The graph shows the effect of changes in pH on the activity of the enzyme lysozyme.
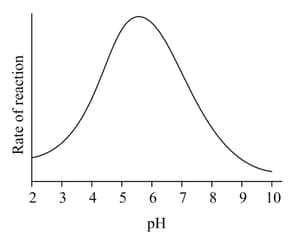
Explain why pH affects the activity of the enzyme.


