Chhattisgarh Board Solutions for Exercise 8: Exercise–1
Chhattisgarh Board Mathematics Solutions for Exercise - Chhattisgarh Board Solutions for Exercise 8: Exercise–1
Attempt the practice questions from Exercise 8: Exercise–1 with hints and solutions to strengthen your understanding. Mathematics Class - 10 solutions are prepared by Experienced Embibe Experts.
Questions from Chhattisgarh Board Solutions for Exercise 8: Exercise–1 with Hints & Solutions
According to an article published in a science magazine the speed of ants in a particular place is affected by the temperature of that place. If the equation shows the relation between the temperature of a place and the speed of ants where temperature, is in '' and speed, is in , then draw the graph between the speed of ants and temperature using . What is the temperature of the place where the speed of ants is per second?
The temperature data for a particular day in a city are shown in the graph. Answer the following questions based on the graph:
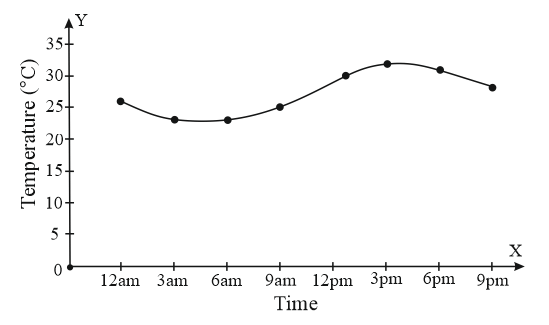
What was the city temperature at
The temperature data for a particular day in a city are shown in the graph. Answer the following question based on the graph:
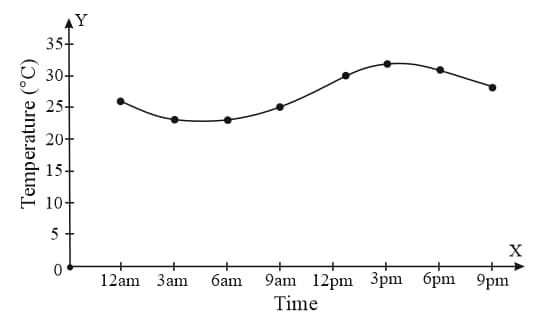
What was the city temperature at in the afternoon?
The temperature data for a particular day in a city are shown in the graph. Answer the following questions based on the graph:
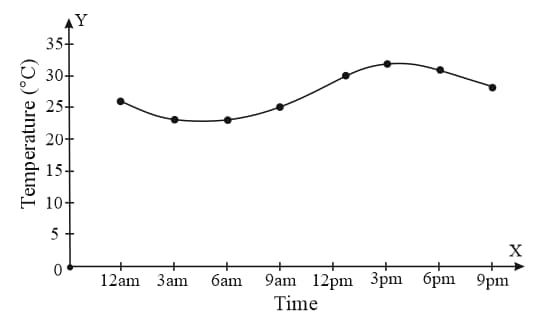
What was the temperature at pm in the night?
The pollutions levels of a city were monitored throughout a day. The pollution levels are shown in a graph; answer the question based on the graph:-
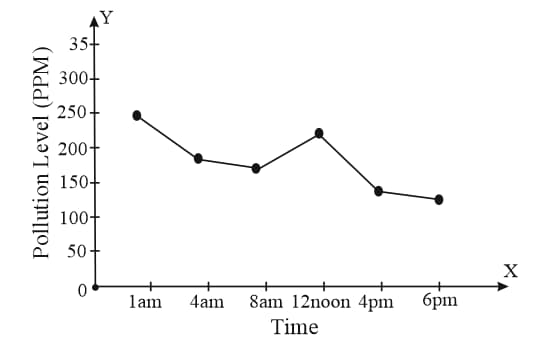
At what time was the highest pollution level recorded?
The pollutions levels of a city were monitored throughout a day. The pollution levels are shown in a graph; answer the following question based on the graph:-
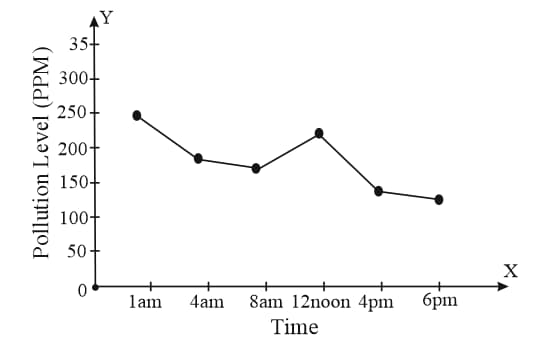
What was the pollution level in the afternoon, at o'clock?
The pollutions levels of a city were monitored throughout the day. The pollution levels are shown in a graph; answer the following question based on the graph:-
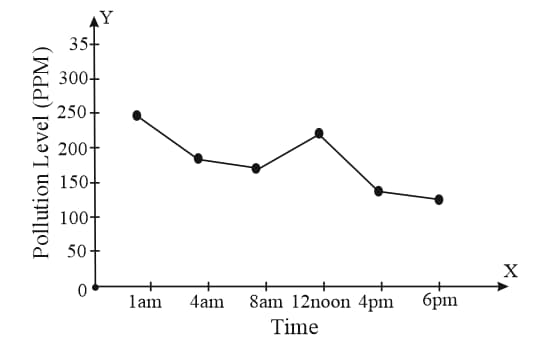
What was the change in pollution level from o'clock noon to o'clock in the evening?
The pollutions levels of a city were monitored throughout a day. The pollution levels are shown in a graph; answer the following question based on the graph:-
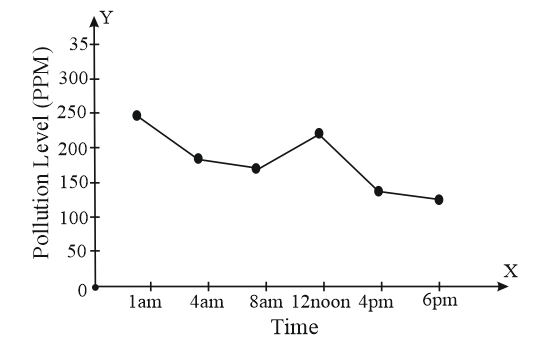
By how much did the pollution level decrease from o'clock at night to o'clock in the morning?
