
Pictorial Representation of Data
Important Questions on Pictorial Representation of Data
Based on the bar graph given below, answer the question that follow.
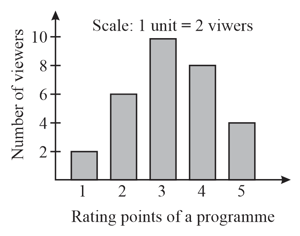
The number of viewers who gave the minimum rating point to the programme is _____.
Based on the bar graph given below, answer the question that follow.
How many viewers were surveyed?
Based on the bar graph given below, answer the question that follow.
What is the rating point given by the largest number of viewers?
Based on the bar graph given below, answer the question that follow.
How many viewers rated the programme below points?
Based on the bar graph given below, answer the question that follow.
How many viewers rated the programme above points?
Based on the bar graph given below, answer the question that follow.
How many viewers gave rating points to the programme?
In a pictograph, if  bunches, then
  represents _____ bunches.
The time taken by students to solve a particular problem in minutes is given below.
Represent the information in a table using tally marks. Represent the information in a bar graph.
The following table gives the information about the number of hot and cold drinks sold in a cafe on a particular day.
| Tea | Coffee | Milk | Fresh Juice | Bottled Juice |
Represent the information using a pictograph.
State whether the following problem requires primary data or requires secondary data.
The favourite picnic spot of ladies in the age group .
State whether the following problem requires primary data or requires secondary data.
The increase/decrease in the number of students opting for school transport in two selected schools.
State whether the following problem requires primary data or requires secondary data.
The marks of school toppers in Class for the last five years.
State whether the following problem requires primary data or requires secondary data.
Teenagers prefer to go to movies in theatres than to buy a CD and watch at home.
A landlord decided to distribute wheat bags to villagers, who were below the poverty line. The number of wheat bags he distributed in months is given below.
| Month | Jan | Feb | March | April | May | June |
| Number of wheat bags |
Represent the information in the form of a bar graph.
The rates per square foot for flats offered by five promoters of flats are given below. Draw a bar graph using a suitable scale.
| Name of the builders | Rate per square foot |
| Anmal Builders | |
| Mahalakshmi Constructions | |
| Smart Living Homes | |
| AB-Builders | |
| Amar Homes |
The stitching charges for a churidar set in four tailoring stores are given in the following table. Represent the data using a bar graph.
| Name of the Store | Stitching charges |
| Perfect Fit | |
| Stitch Well | |
| Lady's Favoutite Shop | |
| Vasthra |
The number of tickets sold for a night show in a theatre for a week is given in the following table. Represent the data in the form of a bar graph using an appropriate scale.
| Day | Sun | Mon | Tue | Wed | Thurs | Fri | Sat |
| Number of tickets sold |
The number of books issued from a library in five days is given below. Represent the information in the form of a bar graph.
| Day | Monday | Tuesday | Wednesday | Thursday | Friday |
| Number of books issued |
The following table gives the temperature recorded in degree Fahrenheit of a city for days. Represent the data using a bar graph.
| Day | Temperature |
| Monday | |
| Tuesday | |
| Wednesday | |
| Thursday | |
| Friday |
A survey was conducted among teenagers to find their favourite amusement park ride. The following table gives the information collected from the survey. Represent the collected information in the form of a bar graph.
| Ride | Number of teenagers |
| Water Ride | |
| Giant Wheel | |
| Free Fall | |
| Roller Coaster |


