
Pictograph
Pictograph: Overview
This topic highlights the representation of data using images. It explains how pictographs are used to represent the frequency of data using symbols or images that are relevant to the data. It also covers various examples.
Important Questions on Pictograph
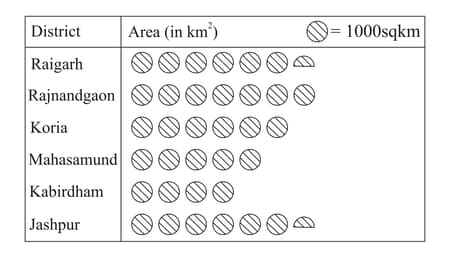
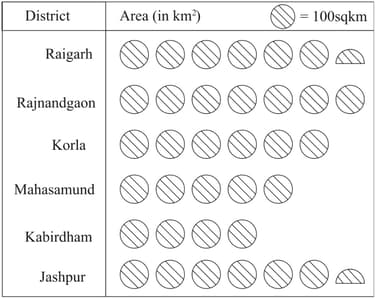
The following pictograph depicts the information about the areas in (to nearest hundred) of some districts of Chhattisgarh state. What is the area of Koria district? If the area is , then write the value of in the answer box.
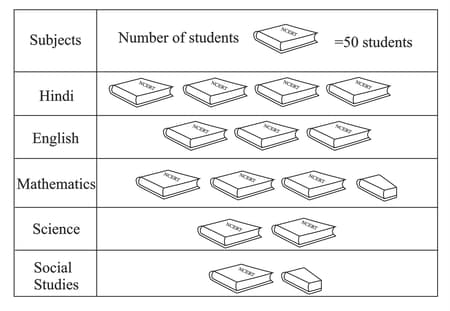
A survey was carried out in a certain school to find out the popular school subjects among students of Classes to . The data in this regard is displayed as pictograph given below. Find the number of students who like subjects other than Mathematics and Science.

A survey was carried out in a certain school to find out the popular school subjects among students of Classes to . The data in this regard is displayed as pictograph given below. How many students like Mathematics?
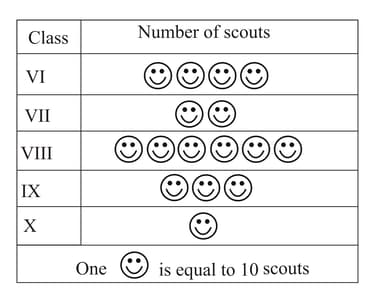
The number of scouts in a school is depicted by the following pictograph:
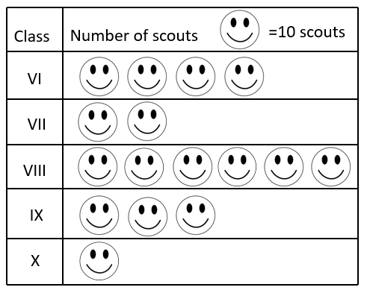
Observe the pictograph and find what is the total number of scouts in the Classes to .
The number of scouts in a school is depicted by the following pictograph. How many scouts are there in Class ?
Students of Class in a school were given a task to count the number of articles made of different materials in the school. The information collected by them is represented as follows:
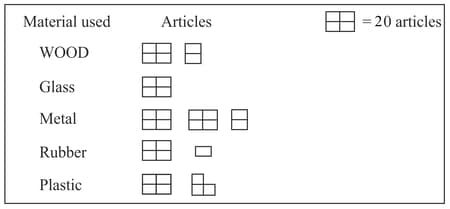
What is the total number of articles counted by the students?
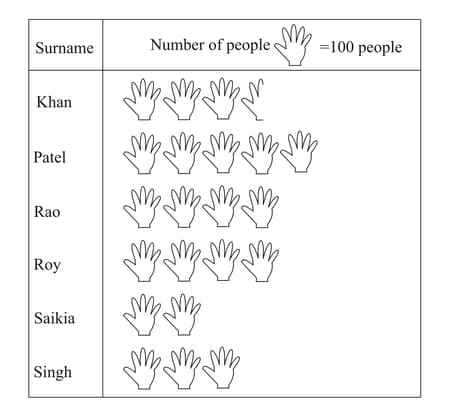
Following pictograph represents some surnames of people listed in the telephone directory of a city. Find how many people have surname ‘Roy’.
The following pictograph depicts the information about the areas in (to nearest hundred) of some districts of Chhattisgarh State.
| District | Area  |
| Raigarh |  |
| Rajnandgaon | |
| Koria | |
| Mahasamund | |
| Kabirdham | |
| Jashpur | |
How many districts have area more than square kilometres?
The following pictograph depicts the information about the areas in (to nearest hundred) of some districts of Chhattisgarh State: Which two districts have the same area?
In a pictograph, if a symbol  represents flowers in a basket then
  stands for _____ flowers.
A _____ represents data through pictures of objects.
In a pictograph, if a symbol  represents books in a library shelf, then the symbol
  represents books.
Pictographs and bar graphs are pictorial representations of the numerical data.
A survey was carried out in a certain school to find out the popular school subjects among students of Classes to . The data in this regard is displayed as pictograph given below: Which subject is the most popular among the students?
| Subjects | Number of students  students students |
| Hindi |     |
| English |    |
| Mathematics |
|
| Science |   |
| Social Studies |   |


The number of scouts in a school is depicted by the following pictograph:

Observe the pictograph and find which class has exactly four times the scouts as that of Class.
The number of scouts in a school is depicted by the following pictograph:

Observe the pictograph and find which class has the maximum number of scouts.
The number of scouts in a school is depicted by the following pictograph:
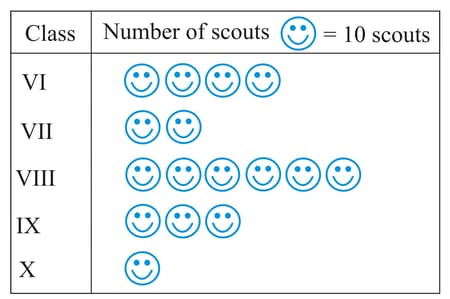
Observe the pictograph and find which class has the minimum number of scouts.
Students of Class in a school were given a task to count the number of articles made of different materials in the school. The information collected by them is represented as follows:
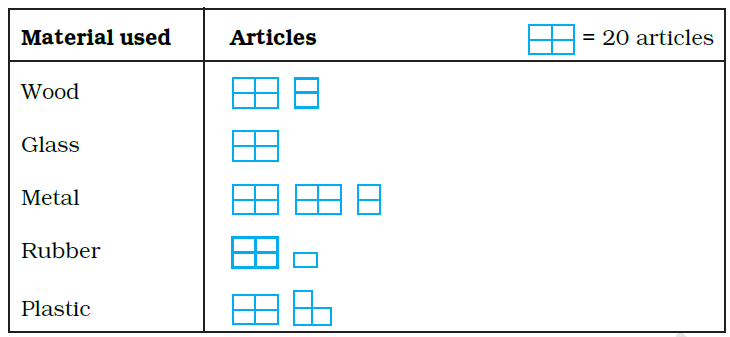
Observe the pictograph and find which material is used in exactly half the number of articles as those made up of metal.
Students of Class in a school were given a task to count the number of articles made of different materials in the school. The information collected by them is represented as follows:

Observe the pictograph and find which material is used in minimum number of articles.
Students of Class in a school were given a task to count the number of articles made of different materials in the school. The information collected by them is represented as follows:

Observe the pictograph and find which material is used in maximum number of articles.


