
NCERT Solutions for Chapter: Introduction to Graphs, Exercise 1: Exercise
NCERT Mathematics Solutions for Exercise - NCERT Solutions for Chapter: Introduction to Graphs, Exercise 1: Exercise
Attempt the practice questions on Chapter 12: Introduction to Graphs, Exercise 1: Exercise with hints and solutions to strengthen your understanding. NCERT Exemplar Mathematics - Class 8 solutions are prepared by Experienced Embibe Experts.
Questions from NCERT Solutions for Chapter: Introduction to Graphs, Exercise 1: Exercise with Hints & Solutions
Study the graph given below of a person who started from his home and returned at the end of the day. Answer the question that follows.

At what time did the person start from his home?
Study the graph given below of a person who started from his home and returned at the end of the day. Answer the question that follows.
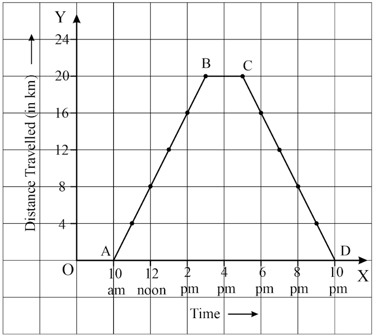
How much distance did he travel in the first four hours of his journey?
Study the graph given below of a person who started from his home and returned at the end of the day. Answer the question that follows.

What was the total distance travelled by him throughout the day?
Study the graph given below of a person who started from his home and returned at the end of the day. Answer the question that follows.

Calculate the distance covered by him in the first of his journey.
Study the graph given below of a person who started from his home and returned at the end of the day. Answer the question that follows.

At what time did he cover of his journey?
Study the graph given below of a person who started from his home and returned at the end of the day. Answer the question that follows.

Calculate the average speed of the man from to .
The two graphs below compare Car and Car . The left graph shows the relationship between age and value. The right graph shows the relationship between size and maximum speed.
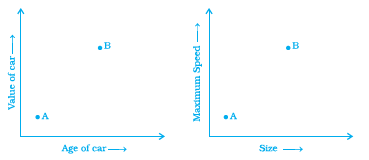
Use the graphs to determine whether each statement is true or false, and explain your answer.
The older car is less valuable.
Sonal and Anmol then made another sequence of designs. Three of the designs are shown below.
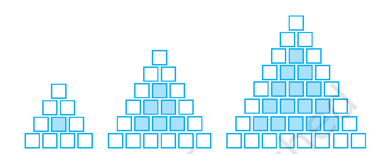
Complete the table
| Rows, r | |||
| Number of white tiles, w | |||
| Number of Purple tiles, p |


