Double Bar Graph
Important Questions on Double Bar Graph
Given below is a double bar graph which shows the scores (out of ) of five students in an Algebra Test with and without preparation. Look at the graph carefully and answer the questions that follow.
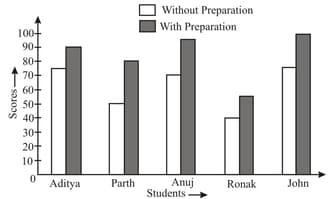
Calculate the percentage increase in Aditya’s score.
Given below is a double bar graph which shows the scores out of of five students in an Algebra Test with and without preparation.
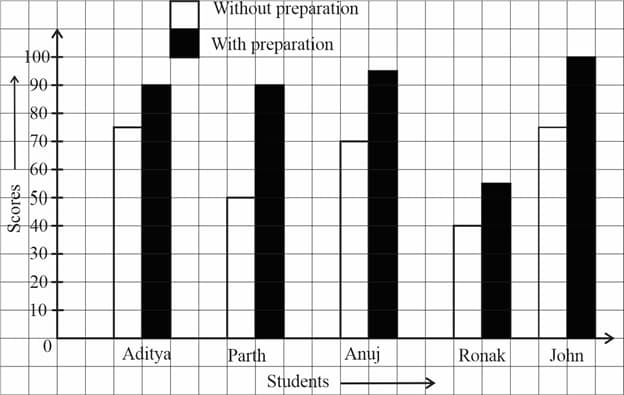
Who has shown the maximum improvement?
The double bar graph given shows the results of a survey on the sale of different ice cream flavours.
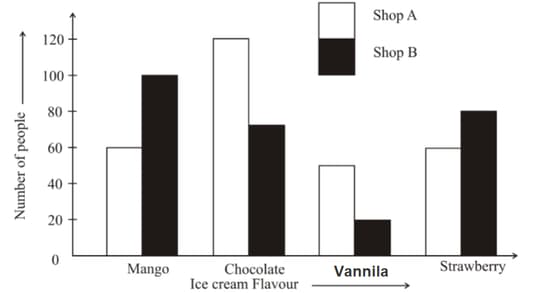
Find the ratio of the number of mango ice creams sold in shop to the number of vanilla ice creams sold in shop .
The double bar graph given shows the results of a survey on sale of different ice cream flavours. Use it to answer the following question.
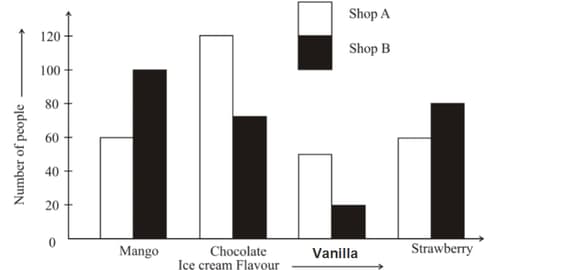
If shop sold 50 vanilla ice creams then find .
The double bar graph given shows the results of a survey on sale of different ice cream flavours. Use it to answer the following questions.
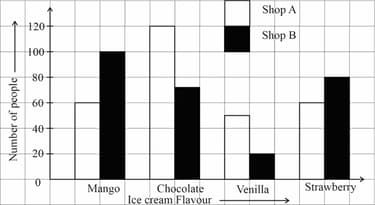
Express the sale of strawberry ice creams in shop as a percent of the total number of ice creams sold.
The double bar graph given shows the results of a survey on the sale of different ice cream flavours. Which flavour of ice cream is liked the most in both the shops together?
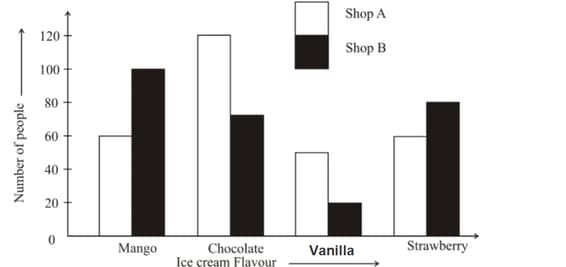
The double bar graph given shows the results of a survey on sale of different ice cream flavours. Use it to answer the following questions.
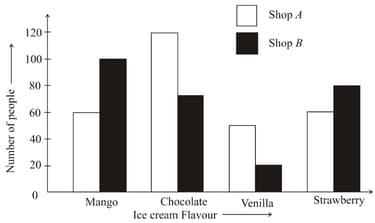
Which flavour of ice cream do people like most in Shop ?
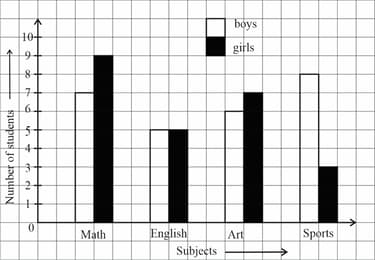
The graph given below shows the favourite subjects of boys and girls of grade of a school. What is the percent of students liking English out of the whole class?
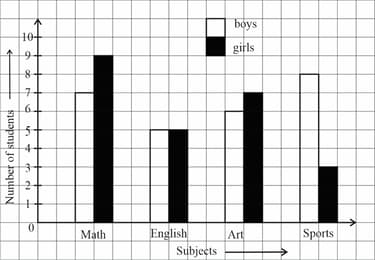
The graph given below shows the favourite subjects of boys and girls of grade of a school.
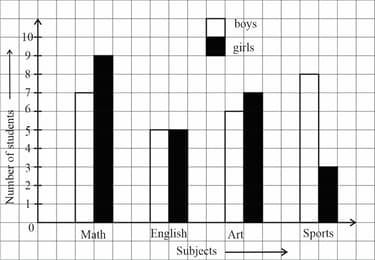
Which subject do boys like more than the girls do?
The graph given below shows the favourite subjects of boys and girls of grade of a school. Which subject was liked the most by both boys and girls?
Given below is a double bar graph which shows the scores (out of ) of five students in an Algebra Test with and without preparation. Look at the graph carefully and answer the questions that follow.
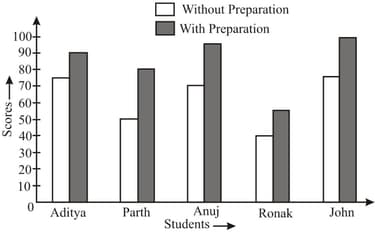
Name the two boys who show an improvement of marks between the two tests.
Given below is a double bar graph which shows the scores (out of ) of five students in an Algebra Test with and without preparation. Look at the graph carefully and answer the questions that follow.
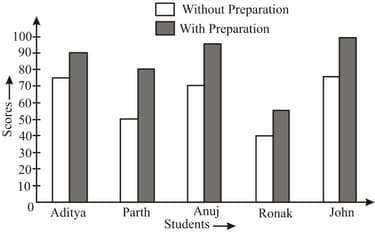
What is the highest score with preparation and who scored it?
Given below is a double bar graph which shows the scores (out of ) of five students in an Algebra Test with and without preparation. Look at the graph carefully and answer the questions that follow.
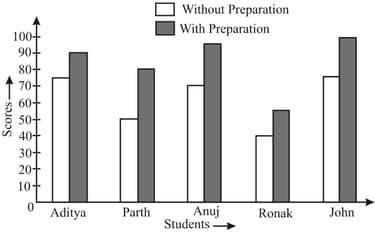
Who has the lowest score without preparation and what is the score?
Each child in a family gets as the weekly pocket money. The table given below shows the money spent and saved by five children during a week from their pocket money. Represent this information by a double bar graph using a suitable scale.
| Name | Poorvi | Bela | Anuradha | Pavan | Chander |
|---|---|---|---|---|---|
| Money spent | |||||
| Money saved |

