Monica Capoor Solutions for Chapter: Data Handling III Pie Charts or Circle Graphs, Exercise 1: EXERCISE
Monica Capoor Mathematics Solutions for Exercise - Monica Capoor Solutions for Chapter: Data Handling III Pie Charts or Circle Graphs, Exercise 1: EXERCISE
Attempt the practice questions on Chapter 9: Data Handling III Pie Charts or Circle Graphs, Exercise 1: EXERCISE with hints and solutions to strengthen your understanding. Number Magic a textbook of Mathematics 8 solutions are prepared by Experienced Embibe Experts.
Questions from Monica Capoor Solutions for Chapter: Data Handling III Pie Charts or Circle Graphs, Exercise 1: EXERCISE with Hints & Solutions
Draw a pie chart for the given data.
The table given below provides the data on money spent (in crores) during the fourth 'Five Year Plan' :
| Item | Agriculture | Communication | Industries | Power | Miscellaneous |
|---|---|---|---|---|---|
| Rupees (in crores) |
Draw a pie chart for the given data.
The following data shows the expenditure of an individual on various items:
| Item | Education | Food | Rent | Clothing | Others |
|---|---|---|---|---|---|
| Expenditure (in ) |
Draw a pie chart for the given data.
The following data represents the number of students who appeared for various subjects in an examination:
| Subject | Physics | Mathematics | English | Biology | Chemistry |
|---|---|---|---|---|---|
| Number of students |
Draw a pie chart for the given data.
The following table gives the number of credit cards issued by five banks in :
| Bank | Standard Chartered | ICICI | SBI | Citibank | Bank of India |
|---|---|---|---|---|---|
| Number of credit cards issued |
Draw a pie chart for the given data.
The following table shows the monthly expenditure of a firm:
| Item | Rent | Wages | Electricity and Water | Taxation |
|---|---|---|---|---|
| Amount (in lakhs of ) |
Draw a pie chart for the given data.
Given below is the percentage break-up of the cost of production of a book:
| Head | Printing | Paper and binding charges | Advertisement | Royalty | Miscellaneous |
|---|---|---|---|---|---|
| Percentage (%) |
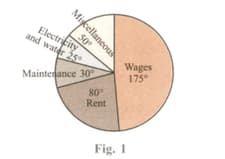
The pie chart in Figure shows the expenditure of a showroom on various heads. If the total expenditure is , find the expenditure on individual heads.
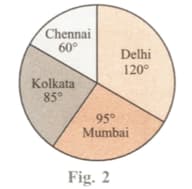
A pie chart representing the population of senior citizens in four metropolitan cities is given in Figure . If the total population of senior citizens is , read the pie chart and find the population of senior citizens in Delhi, Mumbai, Chennai and Kolkata.