
Embibe Experts Solutions for Chapter: Data Interpretation, Exercise 4: Mixed Graphs
Embibe Experts Aptitude Solutions for Exercise - Embibe Experts Solutions for Chapter: Data Interpretation, Exercise 4: Mixed Graphs
Attempt the practice questions on Chapter 1: Data Interpretation, Exercise 4: Mixed Graphs with hints and solutions to strengthen your understanding. Practice book for English and Aptitude for VITEEE solutions are prepared by Experienced Embibe Experts.
Questions from Embibe Experts Solutions for Chapter: Data Interpretation, Exercise 4: Mixed Graphs with Hints & Solutions
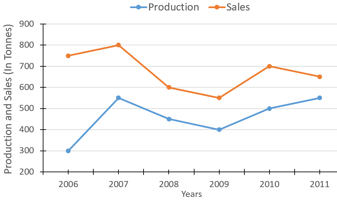
Study the following information and answer the questions that follow: The Graph given below represents the production (in tonnes) and sales (in tonnes) of company A from .

The table given below represents the respective ratio of the production (in tonnes) of company A to the production (in tonnes) of company B, and the respective ratio of the sales (in tonnes) of company A to the sales (in tonnes) of Company B.
| Year | Sales | Production |
What is the average sales of Company B (in tonnes) from the year 2006 to the year 2011?
Study the following information and answer the questions that follow: The Graph given below represents the production (in tonnes) and sales (in tonnes) of company A from .

The table given below represents the respective ratio of the production (in tonnes) of company A to the production (in tonnes) of company B, and the respective ratio of the sales (in tonnes) of company A to the sales (in tonnes) of Company B.
| Year | Production | Sales |
What is the respective ratio of the total sales (in tonnes) of company A of the total production (in tonnes) of company A?
Study the following information and answer the questions that follow: The Graph given below represents the production (in tonnes) and sales (in tonnes) of company A from .
The table given below represents the respective ratio of the production (in tonnes) of company A to the production (in tonnes) of company B, and the respective ratio of the sales (in tonnes) of company A to the sales (in tonnes) of Company B.
| Year | Sales | Production |
What is the respective ratio of sales of company B (in tonnes) in the year 2006 to sales of company B (in tonnes) in the year 2008?
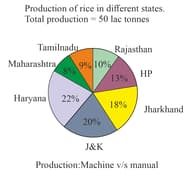
Study the following pie charts & bar charts and answer the following questions:


What is the difference between the production by machine and manual method in Rajasthan?
Study the following pie charts & bar charts and answer the following questions:

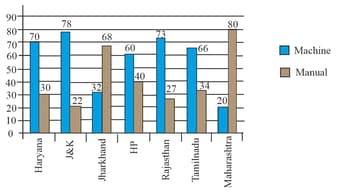
What is the ratio of production by manual method in TN to that of machine method in J&K?
Study the following pie charts & bar charts and answer the following questions:


What is the average production of rice by machine method for all states?
Study the following pie charts & bar charts and answer the following questions:

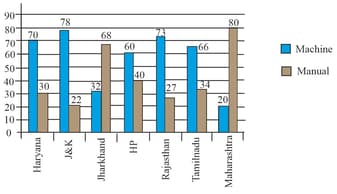
The production by machine method in Haryana is approximately what percent greater than the production by manual method in Maharashtra?
Study the following pie charts & bar charts and answer the following questions:
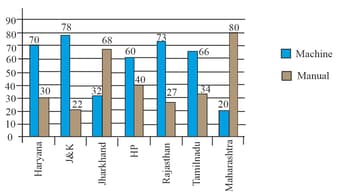
The production of rice in HP by manual method is approximately how many times the production in Jharkhand by machine method?


