Embibe Experts Solutions for Chapter: Data Interpretation, Exercise 5: Pie Chart Representation Of Data
Embibe Experts Aptitude Solutions for Exercise - Embibe Experts Solutions for Chapter: Data Interpretation, Exercise 5: Pie Chart Representation Of Data
Attempt the practice questions on Chapter 1: Data Interpretation, Exercise 5: Pie Chart Representation Of Data with hints and solutions to strengthen your understanding. Practice book for English and Aptitude for VITEEE solutions are prepared by Experienced Embibe Experts.
Questions from Embibe Experts Solutions for Chapter: Data Interpretation, Exercise 5: Pie Chart Representation Of Data with Hints & Solutions
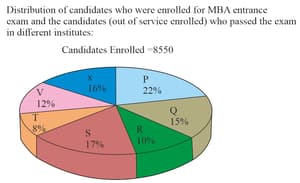
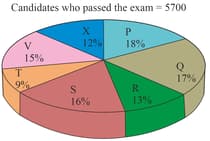
Study the following graph carefully and answer the questions given below:
What is the ratio of candidates who have passed to the candidates who have enrolled from institute P?
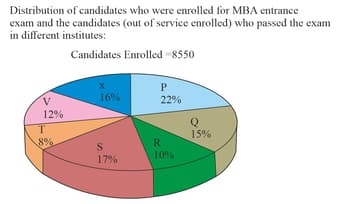
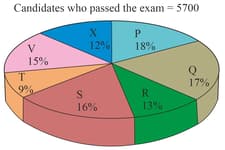
Study the following graph carefully and answer the questions given below: What is the percentage of candidates who have passed to the candidates who have enrolled for institutes Q and R together?
Study the following graph carefully and answer the questions given below:
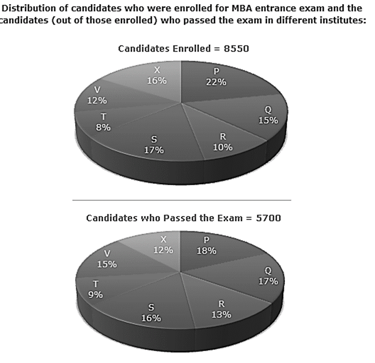
Which institute has the highest percentage of candidates passed to the candidates enrolled?
Study the following graph carefully and answer the questions given below: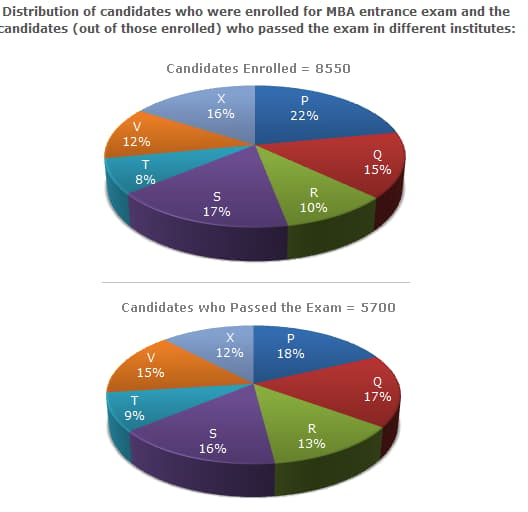
The number of candidates passed from institutes S and P together exceeds the number of candidates enrolled from institutes T and R together by:
Study the pie-chart carefully to answer the following questions.
Cost estimated by a family in renovation of their house.
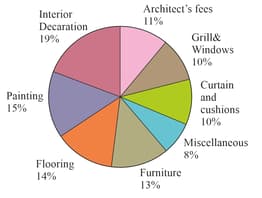
Total estimated cost is Rs 1,20,000
During the process of renovation, the family actually incurred miscellaneous expenditure of Rs. 10,200. The miscellaneous expenditure incurred by the family is what percentage of the total estimated cost?
Study the pie-chart carefully to answer the following questions.
Cost estimated by a family in renovation of their house.
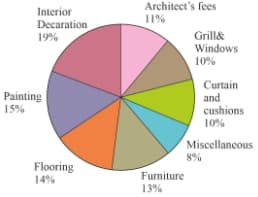
Total estimated cost is
In spite of getting the discount of on the estimated cost of furniture and the actual miscellaneous expenditure being instead of the estimated one, the family's estimated cost is correct. What is the total amount spent by the family in renovating the house?
Study the pie-chart carefully to answer the following questions.
Cost estimated by a family in renovation of their house.
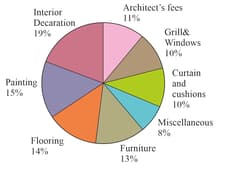
Total estimated cost is Rs 1,20,000.
The family gets a discount on furniture and pays 12% less than the estimated cost on furniture. What is the amount spent on furniture?
Following pie chart shows the monthly expenditure of a man on different items. His monthly income is Rs 8,000.
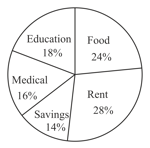
What is the angle shown by medical?
