
S K Gupta and Anubhuti Gangal Solutions for Chapter: Graphs, Exercise 2: Exercise 18(B)
S K Gupta Mathematics Solutions for Exercise - S K Gupta and Anubhuti Gangal Solutions for Chapter: Graphs, Exercise 2: Exercise 18(B)
Attempt the practice questions on Chapter 18: Graphs, Exercise 2: Exercise 18(B) with hints and solutions to strengthen your understanding. ICSE NUMBERS WIZ solutions are prepared by Experienced Embibe Experts.
Questions from S K Gupta and Anubhuti Gangal Solutions for Chapter: Graphs, Exercise 2: Exercise 18(B) with Hints & Solutions
Draw the graph of the function .
Draw the graph of the function . Read from the graph, the value of , when .
Draw a graph to convert miles to kilometres, given mile . Use the graph to find the number of kilometres that are approximately equal to miles?
Draw a graph to convert miles to kilometres, given mile . Use the graph to find the number of miles that are approximately equal to ?
The following diagram shows the temperatures during a day.

Plot the points on a graph and then join the points with straight lines.
The following diagram shows the temperatures during a day.
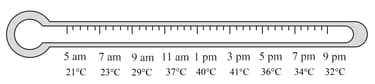
Plot the points on a graph and then join the points with straight lines.
Approximately when did the temperature first reach ? Was the temperature increasing or decreasing at this time?
The following diagram shows the temperatures during a day.

Plot the points on a graph and then join the points with straight lines. For how long was the temperature above ?
The following diagram shows the temperatures during a day.

Plot the points on a graph and then join the points with straight lines. By how much did the temperature fall between p.m. and p.m.?


