
Sunil Batra Solutions for Chapter: Electricity, Exercise 4: PRACTICE QUESTIONS
Sunil Batra Physics Solutions for Exercise - Sunil Batra Solutions for Chapter: Electricity, Exercise 4: PRACTICE QUESTIONS
Attempt the free practice questions on Chapter 1: Electricity, Exercise 4: PRACTICE QUESTIONS with hints and solutions to strengthen your understanding. Modern's ABC+ Of Science Physics solutions are prepared by Experienced Embibe Experts.
Questions from Sunil Batra Solutions for Chapter: Electricity, Exercise 4: PRACTICE QUESTIONS with Hints & Solutions
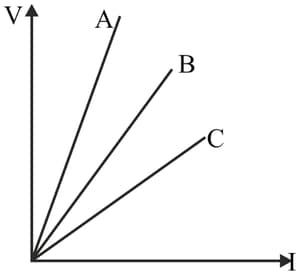
Ohm's law experiment is performed separately with individual resistors , and series combination of , . Graph is plotted between potential difference and current as shown in figure for each case. Identify which one is for , and combination of resistors in graph A, B, and C respectively represents.
In ohm's law experiment, the physical quantity / quantities which is / are to kept constant while doing experiment is / are:
The graph between current and the potential difference in the experimental verification of Ohm's law were drawn by four students as shown in the below figure. Which one of the following is correct?
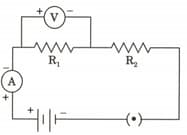
The circuit diagram shown below is used to find the effective resistance of two resistors in series. Which circuit diagram represents correctly?
A student set up the electric circuit shown here for finding the equivalent resistance to two resistors in series. In this circuit:
In the circuits given ahead, the resistors and are connected:
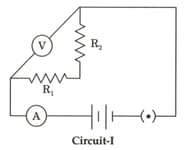
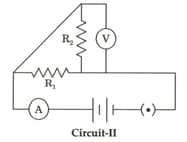
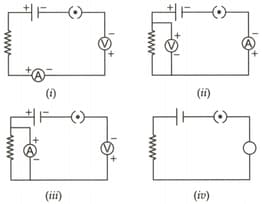
Identify the circuit in which the electrical components have been properly connected:
students plotted the graph showing the dependence of current on potential difference across using their recorded observations. Which of this is the most appropriate graph?


