
Tamil Nadu Board Solutions for Chapter: Statistics, Exercise 4: Exercise
Tamil Nadu Board Mathematics Solutions for Exercise - Tamil Nadu Board Solutions for Chapter: Statistics, Exercise 4: Exercise
Attempt the free practice questions on Chapter 5: Statistics, Exercise 4: Exercise with hints and solutions to strengthen your understanding. Mathematics Standard 6 Term I solutions are prepared by Experienced Embibe Experts.
Questions from Tamil Nadu Board Solutions for Chapter: Statistics, Exercise 4: Exercise with Hints & Solutions
Read the given bar graph which shows the percentage of marks obtained by Brinda in different subjects in an assessment test.
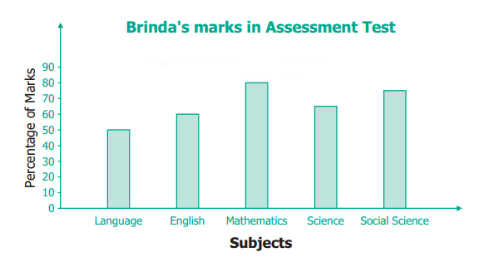
Brinda has scored minimum marks in _____ subject.
Read the given bar graph which shows the percentage of marks obtained by Brinda in different subjects in an assessment test. The percentage of marks scored by Brinda in Science is _____ .
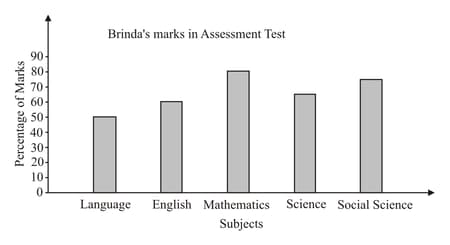
Read the given bar graph which shows the percentage of marks obtained by Brinda in different subjects in an assessment test.
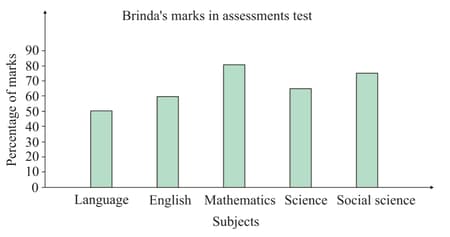
Brinda scored marks in the subject _____.
The pictograph shows the number of branded mobile phones sold in five months.
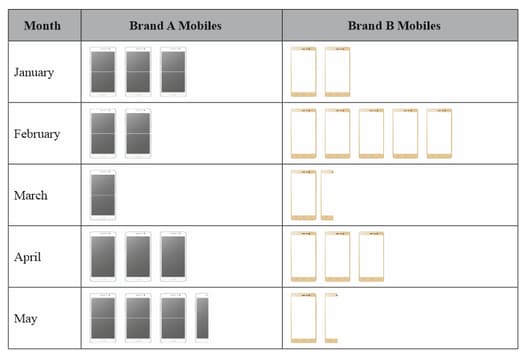
Each picture of  represents mobiles each
  represents mobiles
Observe the given table and answer the following questions.
In which month was the maximum number of brand mobiles sold?
The pictograph shows the number of branded mobile phones sold in five months.
Each picture of represents mobiles each represents mobiles
Observe the given table and answer the following questions.
In which month was an equal number of brand and brand mobiles sold?
The pictograph shows the number of branded mobile phones sold in five months.
Each picture of represents mobiles each  represents mobiles
Observe the given table and answer the following questions.
In which month was the minimum number of brand mobiles sold?
The pictograph shows the number of branded mobile phones sold in five months.
Each picture of represents mobiles each  represents mobiles
Observe the given table and answer the following questions.
Find the total number of Brand Mobiles that were sold in months.
The pictograph shows the number of branded mobile phones sold in five months.
Each picture of represents mobiles each  represents mobiles
Observe the given table and answer the following questions.
What is the difference between the sale of brand and brand Mobiles in the month of May?


