
What is mean formula?
Important Questions on Statistics
What is the mode of the given data?
What is the median of the following list of numbers?
and
The below graph shows the number of students Vs. Marks of students:
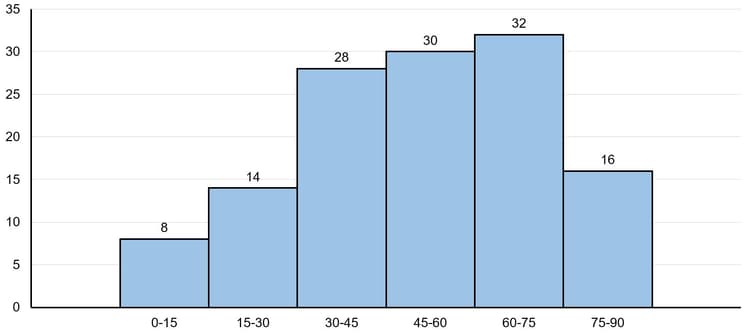
In the given histogram, in which class interval, the median marks lies:
Find the mode of the following frequency distribution.
| Class | |||||||
| Frequency |
The mean and median of is-
1. and $5$
2. and $5.5$
3. and $6$
4. and $5.5$
The table given below shows the salaries of persons.
| Salary | Number of persons |
Calculate the median salary of data. (in ₹)
What is the mode of the following list of numbers :
, , , , , , , , , and ?
The following is the price of Cabbage over 12 months. What is the median price?

. Find the mean score obtained by the team?
If the median of the following frequency distribution is . Find the values of and .
| Class | ||||||||
| Frequency |
Find the mode of the following distribution:
| Class: | |||||||
| Frequency: |
The table below shows the salaries of persons:
| Salary(In thousand ) | Number of persons |
Calculate the median salary of the data in , rounded off to the nearest whole number.
The median of the following data is . Find the values of and , if total frequency is .
| Class | ||||||||||
| Frequency |
For the given data:
| Class | Frequency |
The median is _____.
The mean of the following distribution is . Find the frequency of the class .
| Class | |||||||
| Frequency |
Find the mean of the following distribution:
| Class | |||||
| Frequency |


