
A is a type of graph that records data in a circular manner.
Important Questions on Representation of Data
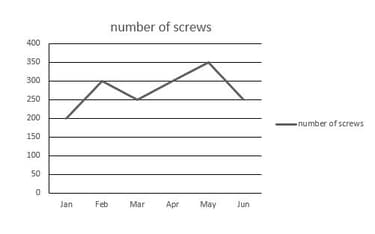
According to the chart below, in which month less than screws were manufactured?
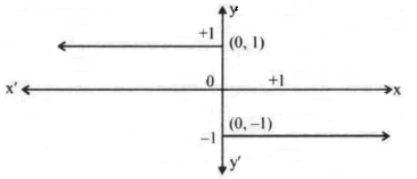
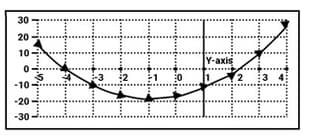
The equation of the graph shown here is:
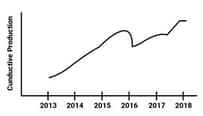
What is wrong with the following cumulative production graph?
There are children in RMM High School. of them went for a picnic. of them went for a visit to the museum. The remaining didn’t go anywhere. Then, the number of children went for the picnic is _____.
Percent Profit Earned by two Companies A and B over the
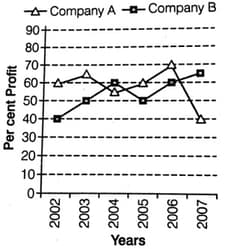
If the incomes of Company B in 2004 and 2005 were in the ratio 3 : 5 respectively, what was the ratio of the expenditures of that company in these 2 yr?
The pictograph shows the number of cars produced by a company during the third quarter of the year 2014.
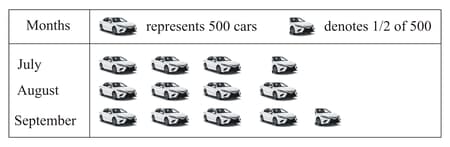
Observe the above pictograph and fill in the blanks.
The total number of cars produced in September in is _____.
Study the graph carefully to answer the question that follows :
Per cent Rise in profit of Two Companies over the Years
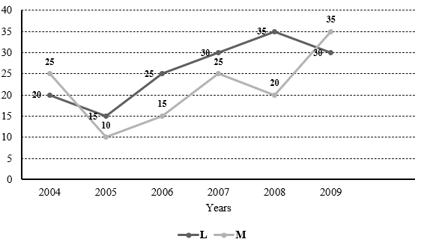
If the profit earned by Company in the year was , what was the amount of profit earned by it in the year ?
The following pie chart shows the different games played by the students of Class VIII.

Observe the above pie chart and answer the following question.
The most popular game among the students is _____ .
Read the following line graph and answer the questions. The temperature was taken for the first 6 days in the month of January.

What is given on the Y-axis? _____
In a school the periodical examinations are held every second month. In a session during Apr. 2001-Mar. 2001. a student of Class IX appeared for each of the periodical exams. The aggregate marks obtained by him in each periodical exam are represented in the line-graph given below. Study the graph and answer the question based on it.
MARKS OBTAINED BY A STUDENT IN SIX PERIODICAL EXAMS HELD IN EVERY TWO MONTHS DURING THE YEAR IN THE SESSION 2001-02.
Maximum Total Marks in each Periodical Exam = 500
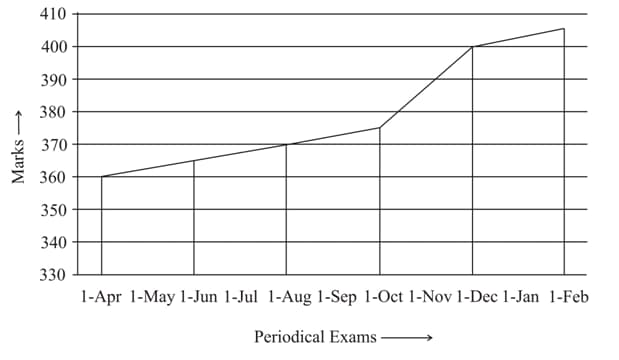
The total number of marks obtained in Feb. 02 is what percent of the total marks obtained in Apr. 01?
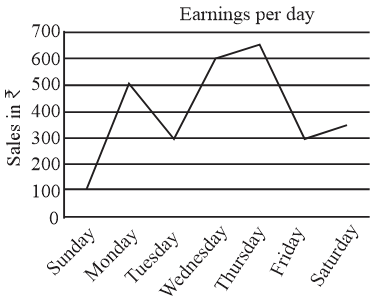
Based on the given graph, the total money earned (in ) in the week is:
The pictograph shows the number of cars produced by a company during the third quarter of the year .
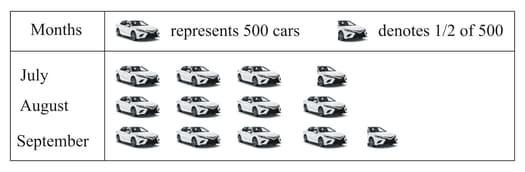
Observe the above pictograph and fill in the blank.
The total number of cars produced during the year is _____ .
Find the equation of the graph shown below.
Read the following graph and answer below-
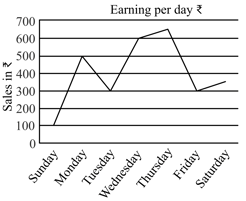
Earnings per day : In rupee
Sales : In rupee
According to the given graph the highest earnings was on:
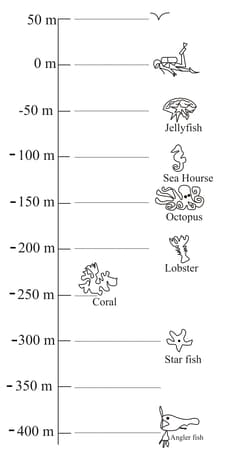
The diver dives from his present position of to _____ to view the Coral.
The following pie chart shows the different games played by the students of Class .
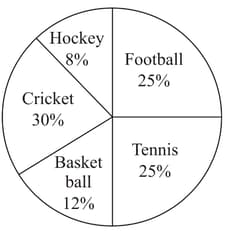
Observe the above pie chart and answer, the game played by least number of students is _____.


