
EASY
8th CBSE
IMPORTANT
Earn 100
A graph that displays data that changes continuously over periods of time is
45.45% studentsanswered this correctly
Important Questions on Introduction to Graphs
EASY
8th CBSE
IMPORTANT
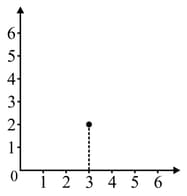
In the given graph the coordinates of point are
EASY
8th CBSE
IMPORTANT
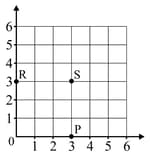
In the given graph the letter that indicates the point is
EASY
8th CBSE
IMPORTANT
EASY
8th CBSE
IMPORTANT
EASY
8th CBSE
IMPORTANT
EASY
8th CBSE
IMPORTANT
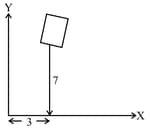
In the given figure the position of the book on the table may be given by
EASY
8th CBSE
IMPORTANT
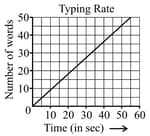
Data was collected on a student's typing rate and graph was drawn as shown below. Approximately how many words had this student typed in seconds?
EASY
8th CBSE
IMPORTANT
Which graphs of the following represent the table below?
| Length of Side of a Square | |||||
| Perimeter |


