
EASY
6th Foundation
IMPORTANT
Earn 100
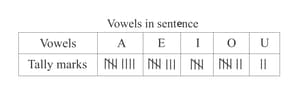
A pictorial representation of data is called_____.
50% studentsanswered this correctly
Important Questions on Data Handling
MEDIUM
6th Foundation
IMPORTANT
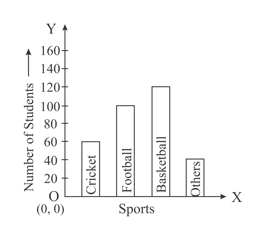
How many more students like basketball than cricket?
MEDIUM
6th Foundation
IMPORTANT
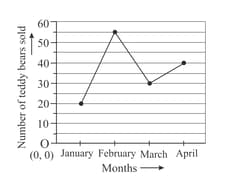
If she earned ₹ for every teddy bear sold, then how much more did she earn in April than in Mach?
HARD
6th Foundation
IMPORTANT
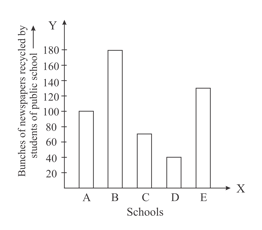
(). recycled more newspapers than .
(). recycled bunches of newspapers more than .
(). Five hundred bunches of newspaper were recycled in all.
(). The ascending order of the newspapers recycled by school is .
HARD
6th Foundation
IMPORTANT
HARD
6th Foundation
IMPORTANT
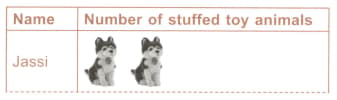
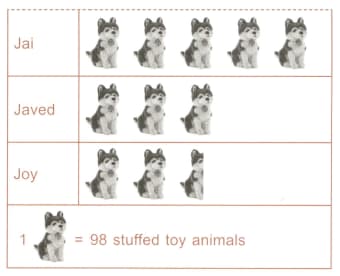
(i) The number of stuffed toy animals Jasssi and joy both have is .
(ii) Javed has more stuffed toy animals than jassi.
(iii) The total number of stuffed toy animals owned by all the students is .
(iv) The number of stuffed by animals joy has less than Javed is .
MEDIUM
6th Foundation
IMPORTANT
The given line graph shows the number of cars and motorcycles sold at Beena’s electronic store from September to December.
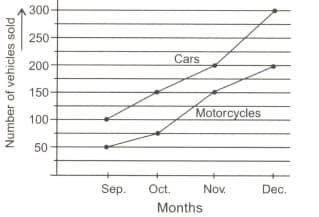
How many more cars than motorcycles did the store sell in October?


