
Analyse the graph and the table shown below and answer the questions.
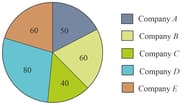
The following graph shows the employee strength of five companies.
The following table shows the production of the companies in the number of units.
Company
Production
What is the difference between the average productivity of the companies with the largest and the smallest number of employees?
The following graph shows the employee strength of five companies.
The following table shows the production of the companies in the number of units.
Important Questions on Data Interpretation
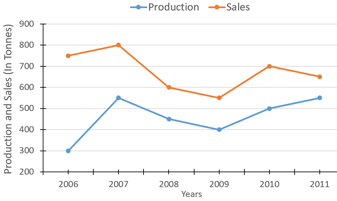
Study the following information and answer the questions that follow: The Graph given below represents the production (in tonnes) and sales (in tonnes) of company A from .

The table given below represents the respective ratio of the production (in tonnes) of company A to the production (in tonnes) of company B, and the respective ratio of the sales (in tonnes) of company A to the sales (in tonnes) of Company B.
| Year | Production | Sales |
What is the approximate percentage increase in the sales of Company A (in tonnes) from the year 2009 to the sales of Company A (in tonnes) in the year 2010?
Study the following information and answer the questions that follow: The Graph given below represents the production (in tonnes) and sales (in tonnes) of company A from .
The table given below represents the respective ratio of the production (in tonnes) of company A to the production (in tonnes) of company B, and the respective ratio of the sales (in tonnes) of company A to the sales (in tonnes) of Company B.
| Year | Production | Sales |
The production of company A in the year 2009 was approximately what percent of the sales of company A in the same year?
Study the following information and answer the questions that follow: The Graph given below represents the production (in tonnes) and sales (in tonnes) of company A from .

The table given below represents the respective ratio of the production (in tonnes) of company A to the production (in tonnes) of company B, and the respective ratio of the sales (in tonnes) of company A to the sales (in tonnes) of Company B.
| Year | Sales | Production |
What is the average sales of Company B (in tonnes) from the year 2006 to the year 2011?
Study the following information and answer the questions that follow: The Graph given below represents the production (in tonnes) and sales (in tonnes) of company A from .

The table given below represents the respective ratio of the production (in tonnes) of company A to the production (in tonnes) of company B, and the respective ratio of the sales (in tonnes) of company A to the sales (in tonnes) of Company B.
| Year | Production | Sales |
What is the respective ratio of the total sales (in tonnes) of company A of the total production (in tonnes) of company A?
Study the following information and answer the questions that follow: The Graph given below represents the production (in tonnes) and sales (in tonnes) of company A from .

The table given below represents the respective ratio of the production (in tonnes) of company A to the production (in tonnes) of company B, and the respective ratio of the sales (in tonnes) of company A to the sales (in tonnes) of Company B.
| Year | Sales | Production |
What is the respective ratio of sales of company B (in tonnes) in the year 2006 to sales of company B (in tonnes) in the year 2008?

What is the difference between the production by machine and manual method in Rajasthan?

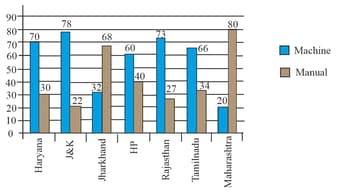
What is the ratio of production by manual method in TN to that of machine method in J&K?

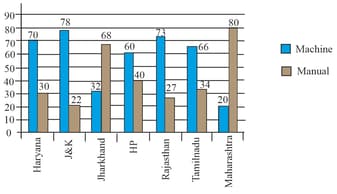
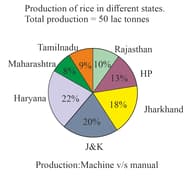
What is the average production of rice by machine method for all states?


