MEDIUM
JEE Main/Advance
IMPORTANT
Earn 100
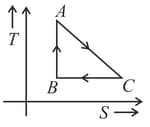
As area under diagram represent work done by gas in a thermodynamic process, area under temperature entropy graph represents heat supplied to the thermodynamic system. Consider the following graph
50% studentsanswered this correctly
Important Questions on Thermodynamics
HARD
JEE Main/Advance
IMPORTANT
EASY
JEE Main/Advance
IMPORTANT
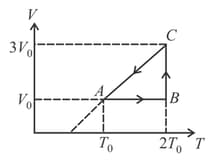
Two moles of an ideal monatomic gas is taken through cycle as shown. Then select the correct statement The symbols have their usual meaning
EASY
JEE Main/Advance
IMPORTANT
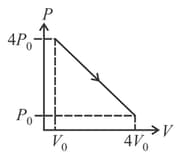
If the indicator diagram for expansion of gas is as shown, the gas
EASY
JEE Main/Advance
IMPORTANT
HARD
JEE Main/Advance
IMPORTANT
HARD
JEE Main/Advance
IMPORTANT
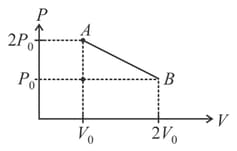
In the given diagram, if temperature at is then maximum temperature during the process is_____