
Calculate the median from the following data,
Roll no
Marks
Important Questions on Mean, Median and Frequency Polygon
Out of a total of observations arranged in ascending order, the and observations are and respectively. What is the median?
The median of following observations arranged in ascending order,
. What is ?
The following data have been arranged in ascending order:
.
If the median of the data is , find .
If is replaced by , find the new median.
Represent the following data by frequency polygon:
| Marks | 10-20 | 20-30 | 30-40 | 40-50 | 50-60 |
| Frequency | 10 | 25 | 12 | 08 | 05 |
Represent the following data by frequency polygon.
| Class | 0-10 | 10-20 | 20-30 | 30-40 | 40-50 |
| Frequency | 3 | 7 | 6 | 2 | 5 |
Represent the following data by frequency polygon.
| Class | 20-29 | 30-39 | 40-49 | 50-59 | 60-69 |
| Frequency | 7 | 3 | 5 | 2 | 5 |
Rohit asked people to draw a line long using a straight edge without any markings on it, here are the lengths in centimetres of the line drawn
Draw up a grounded frequency table for the data. Use a class interval of.
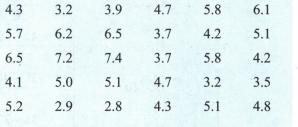
Rohit asked people to draw a line long using a straight edge without any markings on it, here are the lengths in centimetres of the line drawn
| 4.3 | 3.2 | 3.9 | 4.7 | 5.8 | 6.1 |
| 5.7 | 6.2 | 6.5 | 3.7 | 4.2 | 5.1 |
| 6.5 | 7.2 | 7.4 | 3.7 | 5.8 | 4.2 |
| 4.1 | 5.0 | 5.1 | 4.7 | 3.2 | 3.5 |
| 5.2 | 2.9 | 2.8 | 4.3 | 5.1 | 4.8 |
Draw frequency polygon for the data.


