
HARD
Earn 100
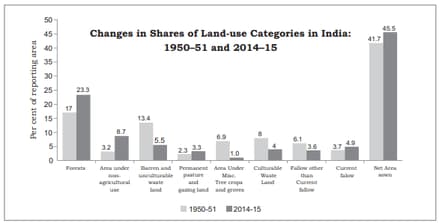
Compare the changes of land-use between 1950–51 and 2014–15 using the below-mentioned graph.
Important Questions on Land Resources and Agriculture
EASY
MEDIUM
MEDIUM
MEDIUM
What is the difference between actual increase and rate of increase? Work out the actual increase and rate of increases for all the land use categories between 1950–51 and 2014–15 from the data given in the Appendix. Explain the results.
| Land Use Classes | 1950-51 (Million Hectare) | Per cent | 2014-15 (Million Hectare) | Per cent |
|---|---|---|---|---|
| Reporting Area | 284.32 | 100 | 307.82 | 100 |
| Forests | 40.48 | 17.0 | 71.79 | 23.3 |
| Area under non-agricultural use | 9.36 | 3.2 | 26.88 | 8.7 |
| Barren and unculturable waste Land | 38.16 | 13.4 | 17.00 | 5.5 |
| Permanent Pasturer and Grazing Land | 6.68 | 2.3 | 10.26 | 3.3 |
| Area under Misc. Tree crops and Groves | 19.83 | 6.9 | 3.10 | 1.0 |
| Culturable Waste Land | 22.94 | 8.0 | 12.47 | 4.0 |
| Fallow other than Current Fallow | 17.45 | 6.1 | 11.09 | 3.6 |
| Current Fallow | 10.68 | 3.7 | 15.09 | 4.9 |
| Net Area Sown | 118.75 | 41.7 | 140.13 | 45.5 |
MEDIUM
MEDIUM
MEDIUM
EASY
EASY
Answer the following question in one word or a sentence.
What is meant by Land-use?
MEDIUM
Answer the following question in to sentences.
What are the main physical features that determine the land-use pattern?
MEDIUM
HARD
HARD
MEDIUM
HARD
HARD
EASY


