
Consider the following statements :
- Two independent variables are always uncorrelated.
- The coefficient of correlation between two variables is positive. When decreases then decreases.
Which of the above statements is/are correct?
Important Questions on Bivariate Data
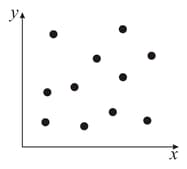
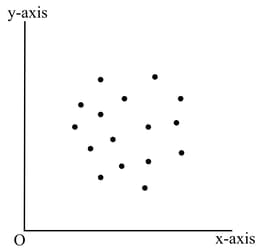
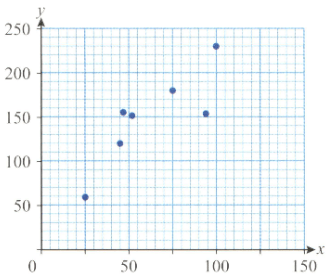
The following graph has
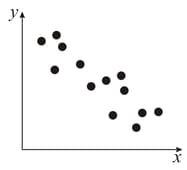
The type of correlation existing between the variables in the graph is
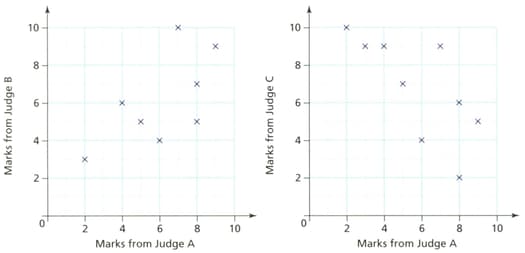
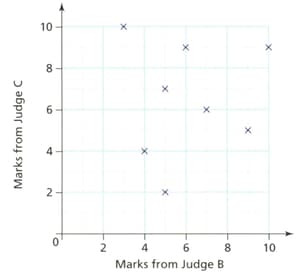
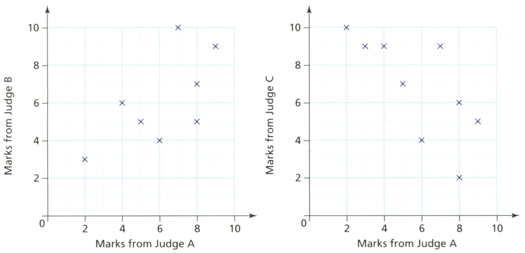
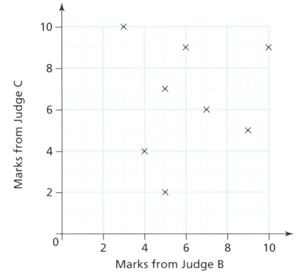
Eight dancers take part in a dance competition. Three judges give each dancer a mark. The scatter diagrams show the marks. Which two judges' marks show positive correlation?
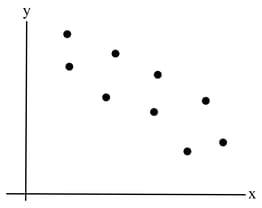
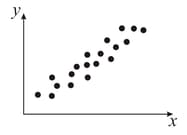
The type of correlation existing between the variables in the graph is

The following graph has
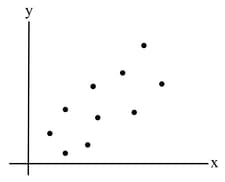
The following graph has

The type of correlation existing between the variables in the graph is
Eight dancers take part in a dance competition. Three judges give each dancer a mark. The scatter diagrams show the marks. Which two judges' marks show no correlation?
The type of correlation existing between the variables in the graph is
The following graph has
The following graph has

The type of correlation existing between the variables in the graph is

The type of correlation existing between the variables in the graph is
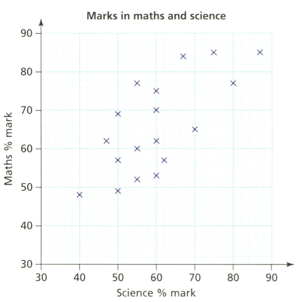
Students take tests in maths and science. Mishal makes this conjecture: "Student with higher marks in science also tend to have higher marks in maths test."
She collects data from some of her class and draws this scatter graph.
The following graph has

Eight dancers take part in a dance competition. Three judges give each dancer a mark. The scatter diagrams show the marks. Which two judges' marks show positive correlation?


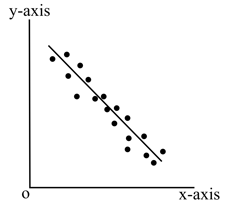
What is the correlation by the following scatter diagram? You should comment on the strength of correlation.
The type of correlation existing between the variables in the graph is


