Data can be represented only in line and bar graphs.
Important Questions on Introduction to Graphs
The given table represents the exports (in crores) of four items over a period of six years. Study the table and answer the question that follows:
| Items | A | B | C | D |
| Year | ||||
What is the ratio of total exports of item in andto the total exports of item in and :
The monthly fees for facilities provided by a sports complex house is as follows:
For Gym, for Swimming Pool , for Tennis court . The list of members using these facilities is as below. How much do they earn from members using the gym each month?
| Facilities | Number of Members |
| Gym | |
| Swimming Pool | |
| Tennis Court |
| A | B | C | D | E | |
| Salary | |||||
| Overtime | |||||
| Arrears | |||||
| Bonus | |||||
| Miscellaneous income | |||||
| Total |
For employee D, the income from overtime is what percentage of his total income :
The given histogram shows the frequency distribution of the speed of cars passing through a particular spot on a highway. Read the graph and answer the following question.
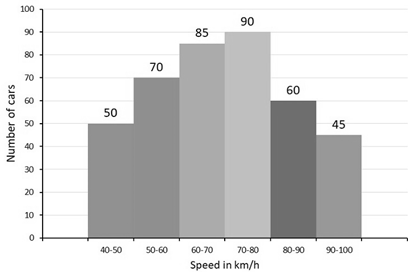
The number of cars with speed () in the interval () is what percentage less than the number of cars with speed () in the interval () ? (Correct to one decimal point)
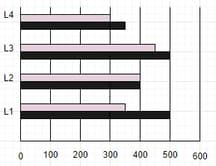
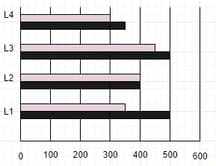
The bar chart represents number of fiction and non-fiction books in four libraries L1, L2, L3 and L4. Consider the bar chart and answer the question based on it:
| L1 | L2 | L3 | L4 | |
| Non-Fiction (Pink) | 350 | 400 | 450 | 300 |
| Fiction (Black) | 500 | 400 | 500 | 350 |
The ratio of total books of libraries L1 and L3 to L2 and L4 is:
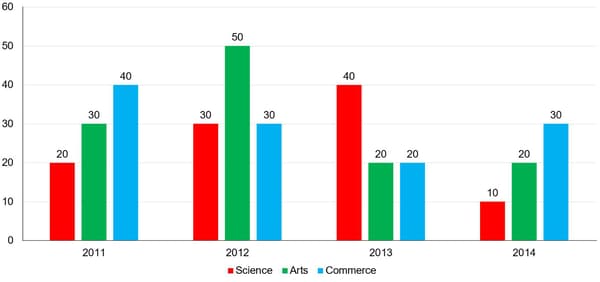
The number of students in Class in Science, Arts and Commerce streams of a school over a period of years () has been depicted through the bar chart given below:
What is the difference between the averages of the number of Science and Commerce students in the given class over the given period of years?
As per data shown in the following table,what is the percentage of students who got less than marks?
|
Marks obtained |
|||||||
|
Number of students |
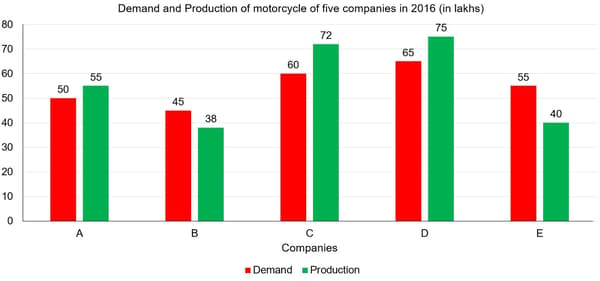
Study the following bar graph and answer the question given:
The number of companies whose production of the motorcycle is equal to or more than the average demand of motorcycles (per year) over five years is:
Direction: Study the graph carefully to answer these question.
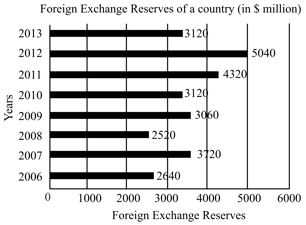
What is the percentage increase in the foreign reserves in over ?
Direction: Study the graph carefully to answer these question.
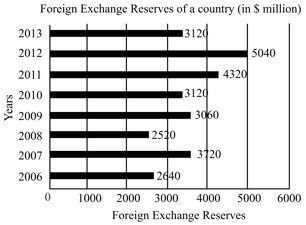
The foreign exchange reserve in was how many times that in ?
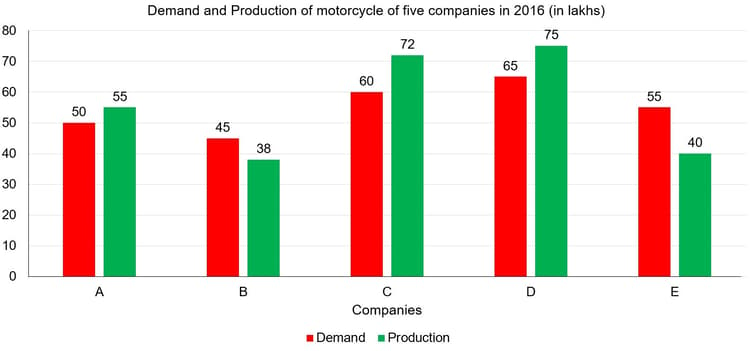
Study of the following bar graph and answer the question given:
The total production of the motorcycle of companies C, D and E is what per cent less than the total demand of motorcycles of all the companies five years?
The bar chart represents number of fiction and non-fiction books in four Libraries . Consider the bar chart and answer the question based on it.
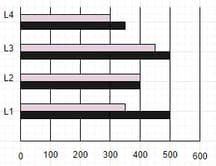
| Non-Fiction (Pink) | ||||
| Fiction (Black) |
The ratio of total number of non-fiction to fiction books in all libraries is-
1.
2.
3.
4.
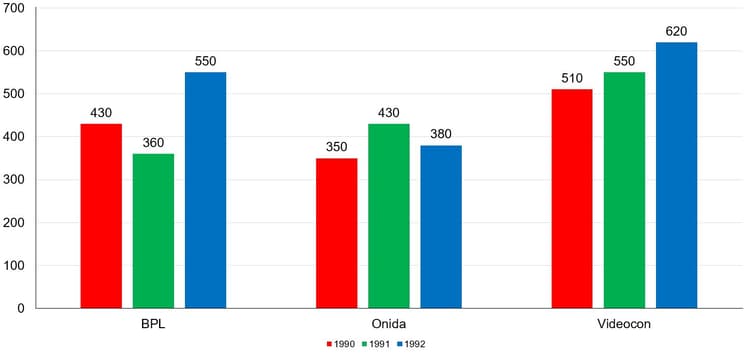
The given bar chart shows the sales (in thousands) for sets of television of three companies in three years.
In the given bar chart, What is the difference between the average sales of televisions BPL and Onida for ?
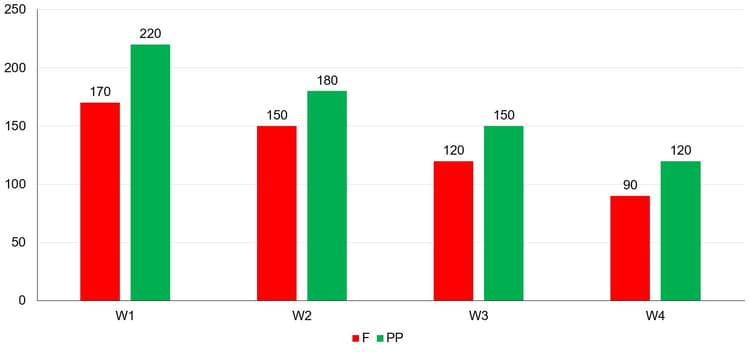
The fasting blood sugar level () and the postprandial blood sugar level () of a patient was monitored for four weeks and , and the readings (in ) for the four weeks are as follows:
These have been presented through a bar graph. The normal range is considered to be:
During which week was the fasting blood sugar level of the patient approximately above the upper limit of normal blood sugar level?
The table below shows the admissions and transfers in standards of a school.

In the given table, what was the total strength in standards at the end of ?
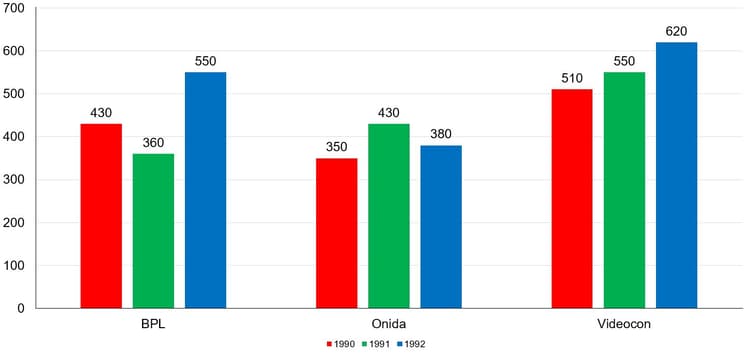
The given bar chart shows the sales (in thousands) for sets of television of three companies in three years.
In the given bar chart, what is the ratio of television sales between BPL in and Videocon in year ?
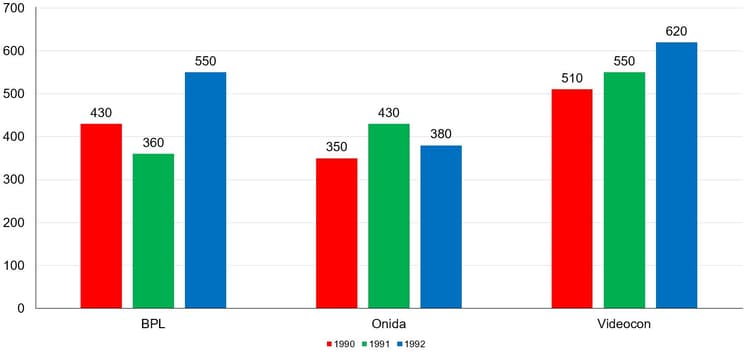
The given bar chart shows the sale (in thousands) for sets of television of three companies in three years.
In the given bar chart, if the profit earned per television by Videocon in was , the total profit earned was:
The graph below shows three types of grains produced(in tonnes) in four states A, B, C and D.
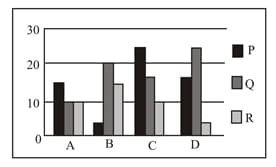
What percentage of grain Q is produced by state D out of the total quantity of Q produced by all states?
The bar chart represents number of fiction and non-fiction books in four libraries L1, L2, L3 and L4. Consider the bar chart and answer the question bsed on it -
| L1 | L2 | L3 | L4 | |
| Non-Fiction (Pink) | 350 | 400 | 450 | 300 |
| Fiction (Black) | 500 | 400 | 500 | 350 |
What is the percentage difference of total number of fiction books in libraries L3 and L4 to the non-fiction books in L3 and L4?
.
.
.
. It is the same
The expenditure of a municipal corporation of a city in different sectors is given below:
| Sector | Expenditure (in Lakh) |
| Education | |
| Health services | |
| Beautification | |
| Surface transport | |
| Others |
Draw a pie-chart to represent the above data.


