
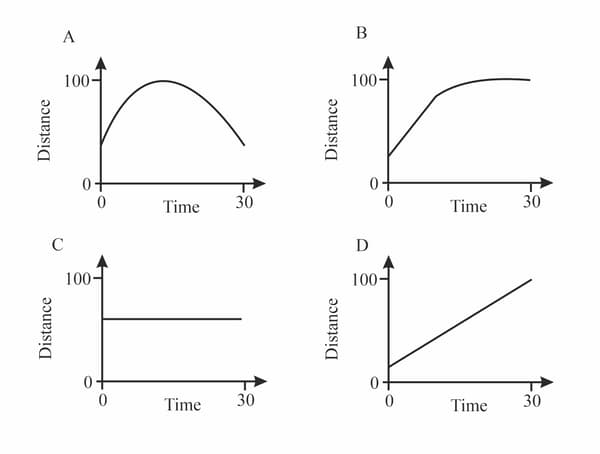
Diagrams in are distance—time graphs for four moving objects. Complete the table by indicating (in the second column) the graph or graphs that represent the motion described in the first column.
Description of motion
Graphs
Moving at a steady speed
Stationary (not moving)
Slowing down and stopping
Changing speed
Important Questions on Describing Motion
Sketch a distance-time graph for the car whose journey is described here.
• The car set off at a slow, steady speed for .
• Then it moved for at a faster speed.
• Then it stopped at traffic lights for before setting off again at a slow, steady speed.
In an advertisement, a car is described like this: 'It can accelerate from to in '. Calculate by how much its speed increases in each second (on average).
On the Moon, gravity is weaker than on Earth. A stone falls with an acceleration of on the Moon. Calculate how long it will take to reach a speed of . upto two decimal points.
A stone is thrown upwards on Earth, where the acceleration of free fall is , leaving the ground at . This is then repeated on Pluto, where gravity is . Calculate how much longer the stone takes to stop on Pluto upto two decimals. Ignore air resistance in your calculations.
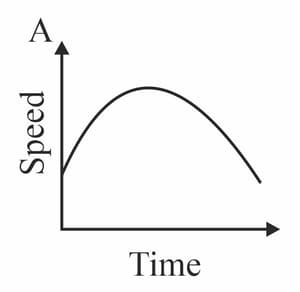
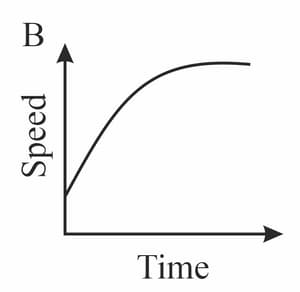
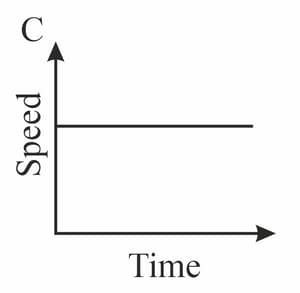
Diagrams A - D in figure show speed - time graphs for four moving objects. Complete the table by indicating in the second column the graph or graphs that represent the motion described in the first column.
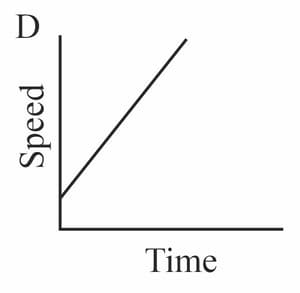
| Description of motion | Graphs |
| Moving at a steady speed | |
| Speeding up, then slowing down | |
| Moving with constant acceleration | |
| Accelerating to a steady speed |
The graph represents the motion of a car that accelerates from rest and then travels at a steady speed.
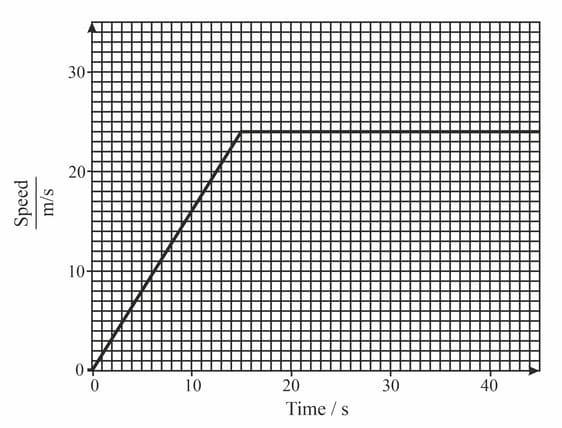
Determine the acceleration of the car in the first part or its journey from the graph.


