
Distinguish between interval and ratio variables.
Important Questions on Statistics
Question
Milka is the niece of Lali. Can we find out the present age of Lali on the basis of statements given below?
Statement
I. The mean of their age is 28.
II. Lali was born in 1976.
You have a question followed by two statements. Which of the following statement(s) is/ are required/sufficient to answer the question ?
Question : What is the total weight of 20 boxes of vegetables ? Each of them is of equal weight.
I. Of 10 boxes, one third of each box weighs 10kg.
II. Total weight of 6 boxes is 60kg more than that of 4 boxes.
Question:
What will be the code of HOME
Statements:
1. The code of “This is my home” is “Te e me huch”
2. The code of “home sweet home” is “huch tee huch”
Question
What is the number of pyramids in the box?
Statements
I. There are some yellow, red, and blue colored pyramids in the box.
II. There are 6 yellow, 7 red and some blue coloured pyramids in the box.
Read the question below and decide which statement/s is/ are sufficient to answer the question.
Question:
Mridual has four almirahs and 24 books. She wants to organize her books. How many books can be kept in one almirah?
Statement:
1. In shelf one twice the number of books can be kept in comparison to shelf two.
2. 12 books can be kept in shelf four.
3. Only 6 books can be kept in shelf three.
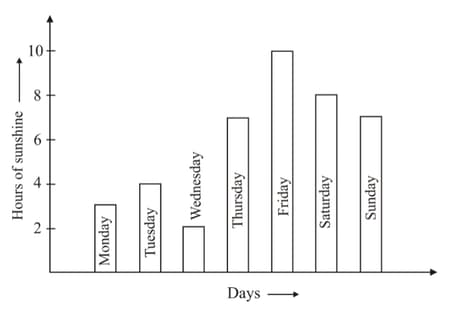
Observe the above bar graph during the entire week, the total number of hours of sunshine on various days, is _____.
If the class marks of a distribution are ; then the class intervals are of length _____.
The midpoint of the class interval is called _____ .
In a grouped frequency distribution, the difference between lower limit and upper limit of a class is called _____. [class interval/ class size/ class mark/ class limits]
The class mark of the class interval is _____.
Data means information in the form of _____figures.
The following bar graph shows the number of hours of sunshine on each of the days of a week.
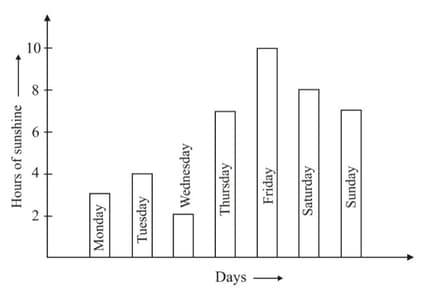
The sunshine was for the minimum number of hours on _____.
The mid-point of a class _____ is called its Class Mark.
If the class marks in a frequency distribution are ; then the class size of the distribution is _____.
If the class-marks of a distribution are ; then the width of each class interval is _____.


