
EASY
Earn 100
Explain Perfect Negative Correlation. Draw a scatter plot for Perfect Negative Correlation.
Important Questions on Scatter Diagrams and Correlation
EASY
Find the coefficient of correlation from the following data:
MEDIUM
EASY
EASY
EASY
MEDIUM
MEDIUM
EASY
MEDIUM
MEDIUM
Find correlation coefficient:
EASY
MEDIUM
EASY
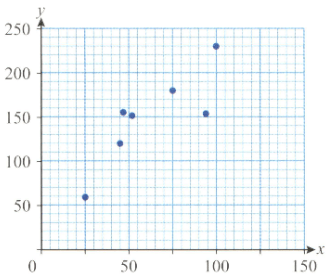
Determine the value of correlation coefficient for the scatter diagram given below.
EASY
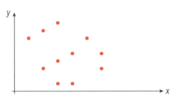
The type of correlation existing between the variables in the graph is
EASY
Define extrapolation and then determine the value of at on the straight line using a linear extrapolation method if the two given points that lie on the straight line is and .
EASY
Give an example for positive correlation?
MEDIUM
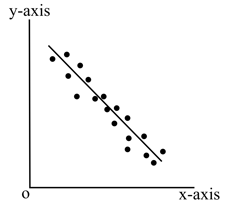
What is the correlation by the following scatter diagram? You should comment on the strength of correlation.
EASY
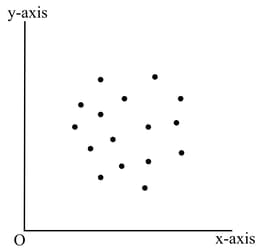
The type of correlation existing between the variables in the graph is
EASY
EASY


