
Explain the reading and interpretation of bar graphs.
Important Questions on Data Handling-III (Bar Graphs)
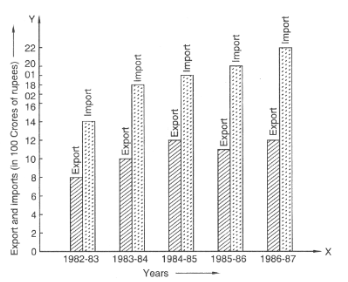
What information is given by the bar graph?
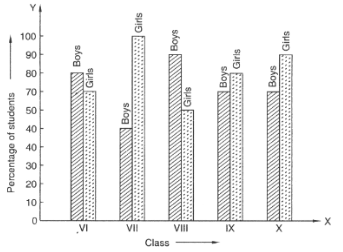
The above bar graph shows the results of an annual examination in a secondary school. Identify the pair of classes in which the results of boys and girls are inversely proportional :
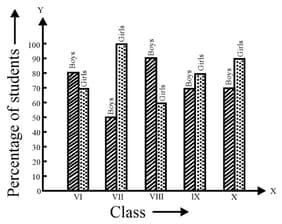
The above bar graph shows the results of an annual examination in a secondary school. Identify the class having the lowest pass rate of students (boys or girls).
The production of saleable steel in some of the steel plants of our country during is given below:
| Plant | Bhilai | Durgapur | Rourkela | Bokaro |
| Production (in thousand tonnes) |
Construct a bar graph to represent the above data on a graph paper by using the scale big divisions thousand tonnes.
The following data gives the number (in thousands) of applicants registered with an Employment Exchange during.:
| Year | ||||||
| Number of applicants registered (in thousands) |
Construct a bar graph to represent the above data.
The following table gives the route length (in thousand kilometres) of the Indian Railways in some of the years:
| Year | |||||
| Route length (in thousand kilometres) |
Represent the above data with the help of a bar graph.
The following data gives the amount of loans (in crores of rupees) disbursed by a bank during some years:
| Year | |||||
| Loan (in crores of rupees) |
Represent the above data with the help of a bar graph.
The following data gives the amount of loans (in crores of rupees) disbursed by a bank during some years:
| Year | |||||
| Loan (in crores of rupees) |
With the help of the bar graph, indicate the year in which amount of loan is not increased over that of the preceding year.


