
Find the mean of the following distribution by taking assumed mean as .
Class interval
Important Questions on Statistics
What is the median of the following list of numbers?
and
The below graph shows the number of students Vs. Marks of students:
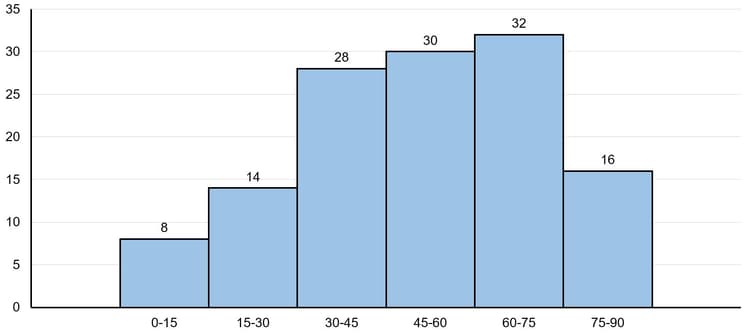
In the given histogram, in which class interval, the median marks lies:
The mean and median of is-
1. and $5$
2. and $5.5$
3. and $6$
4. and $5.5$
For the given data:
| Class | Frequency |
The median is _____.
What is the mode of the following list of numbers :
, , , , , , , , , and ?
The following is the price of Cabbage over 12 months. What is the median price?

. Find the mean score obtained by the team?
The wickets taken by a bowler in cricket matches are as follows:
The mode of the data is
Find the mean of the following distribution:
| Class | |||||
| Frequency |
The modal class of the frequency distribution given below is _____.
| Class | |||||
| Frequency |
Making frequency distribution table from the given cumulative frequency distribution table, find the mode of the data.
| Class | ||||||||
| Frequency |
The mean of the data is then the mean of will be
The mean of the following distribution is . Find the frequency of the class .
| Class | |||||||
| Frequency |


