
Find the value of for different values of and draw a graph between and . The values of are integer numbers between and .
Important Questions on Graphs
The table below shows the quantities of onions consumed (in ) over weeks by a family.
| Week | |||||
| Quantity of onion (in ) |
Draw a graph between the week and quantity of onion consumed.
Anita made some musical instruments using pipes of different lengths. The mathematical relation between the length of pipe (in ) and the pitch (cycles per second) of music is shown in the table below:
| Pitch (cycles per second) | ||||||||
| Length of pipe (in ) |

Look at the graph and answer the following question:
What should be the length of pipe to obtain a pitch of cycles per second?
Anita made some musical instruments using pipes of different lengths. The mathematical relation between the length of pipe (in ) and the pitch (cycles per second) of music is shown in the table below:
| Pitch (cycles per second) | ||||||||
| Length of pipe (in ) |
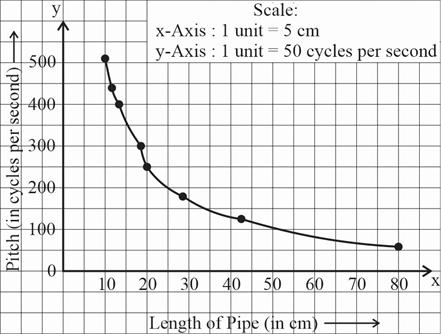
Look at the graph and answer the following questions:
What will be the pitch when the length of pipe is


