
If a pie chart represents the percentage of students who have interest in different sports, the central angle for the sector representing students playing cricket is . What is the percentage of students who loves to play cricket.
Important Questions on Organisation of Data
The daily wage of a person in rural area is Rs. 200 an the poverty line for a person is fixed at Rs. 800 per month for rural areas. Following table shows the detail of employment of four families living in a village. Identify the family living below poverty line:
| Family | Total days of Employment of got in a month by the family | Members of family |
| Ram | 10 | 2 |
| Radha | 18 | 3 |
| Raju | 12 | 4 |
| Pooja | 25 | 5 |
The given pie-diagram shows the marks scored by a student in different subjects e.g. English, Hindi, Mathematics, Science and Social Science in an examination. Assuming that the total marks for the examination is answer the following question:

The subject in which the student scored marks is
The given pie-diagram shows the marks scored by a student in different subjects e.g. English, Hindi, Mathematics, Science and Social Science in an examination. Assuming that the total marks for the examination is answer the following question:

The marks obtained in three subjects English, science and Social Science is what percentage of the total marks ?
The given pie-diagram shows the marks scored by a student in different subjects e.g. English, Hindi, Mathematics, Science and Social Science in an examination. Assuming that the total marks for the examination is answer the following question:
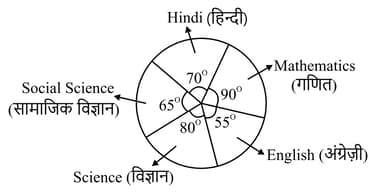
The marks scored in Hindi and Mathematics exceed the marks scored in English and Social Science by:
Arrange the following households in ascending order of per capita income.
| Name of Household | Total Income of Household | Size of the Household |
| Rajat | 6000 | 5 |
| Raman | 5000 | 5 |
| Suman | 3200 | 4 |
| Priya | 8400 | 6 |
The given pie-diagram shows the marks scored by a student in different subjects e.g. English, Hindi, Mathematics, Science and Social Science in an examination. Assuming that the total marks for the examination is answer the following question:

The subject in which the student scored marks ?
Study the pie chart and information given below and answer the following questions. There are students in the school who opted Gardening as a hobby.
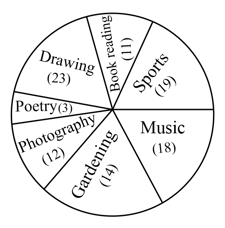
How many students have Drawing as a hobby ?
The given pie-diagram shows the marks scored by a student in different subjects e.g. English, Hindi, Mathematics, Science and Social Science in an examination. Assuming that the total marks for the examination is answer the following question:

The marks scored in Mathematics is what percentage of the total marks ?
The given table represents the exports (in ₹crores)of four items and over a period of six years. Study the table and answer the question that follows.
| Items | ||||
| Years | ||||
The total exports of item in and is what percentage of the total exports of all the four items in and ?


