
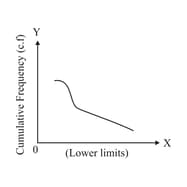
In More than Ogive curve, cumulative frequencies are marked against the lower limit of the respective classes.
Important Questions on Statistics
During the medical check-up of students of a class, their weights were recorded as follows. Draw a less than type of ogive for the given data:
| Weight in kg | Number of students |
| Less than | |
| Less than | |
| Less than | |
| Less than | |
| Less than | |
| Less than | |
| Less than | |
| Less than |
From the frequency distribution table given below, draw less than ogive:
| Marks obtained | |||||
| Frequency |
An insurance policy agent found the following data for distribution of ages of policy holders. Draw a ''less than type'' (below) of ogive for the given data:
| Age(in years) | Number of policy holders |
| Below | |
| Below | |
| Below | |
| Below | |
| Below | |
| Below | |
| Below |
Find the median of the data from the above graph.
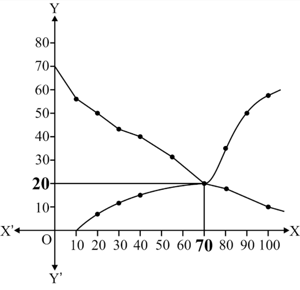
State the type for curve A and curve

The following distribution gives the daily income of workers of a factory.
| Daily income (in Rupees) | |||||
| Number of workers |
Convert the distribution above to a less than type cumulative frequency distribution, and draw its ogive.
50 students enter for a school javelin throw competition. The distance (in metre) thrown are recorded below
| Distance (in m) | |||||
| Number of students |
Draw a cumulative frequency curve (less than type) and calculate the median distance drawn by using this curve.
Profit (in ) earned by a company during the period 2011-2016 are given
below. Draw a simple bar diagram to this data showing profit
| Year | Profit |
Find the year in which the company earned a maximum profit.
During the medical check-up of students of a class, their weights were recorded as follows:
| Weight (in kg ) | Number of students |
| Less than Less than Less than Less than Less than Less than Less than Less than |
Draw a less than type ogive for the given data. Hence, obtain the median weight from the graph and verify the result by using the formula.
The production yield per hectare of wheat of some farms of a village are given in the following table:
| Production yield (in kg/ha) | |||||||||
| Number of farms |
Draw a less than type ogive and a more than type ogive for this data
The following table gives production yield per hectare of wheat of farms of a village.
| Production yield | ||||||
| Number of farmers |
Change the distribution to a more than type distribution and draw its ogive.
The given distribution shows the number of wickets taken by the bowlers in one-day international cricket matches:
| Number of Wickets | Less than | Less than | Less than | Less than | Less than | Less than | Less than | Less than |
| Number of bowlers |
Draw a ‘less than type’ ogive from the above data. Find the median.
The distribution of heights (in ) of children is given below
| Height (in ) | Number of Children |
Draw a less than type cumulative frequency curve for this data and use it to compute median height of the children.
The following is the frequency distribution of duration for calls made on a mobile phones.
| Duration (in s) | Number of calls |
Calculate the average duration (in sec) of a call and also find the median from a cumulative frequency curve.


